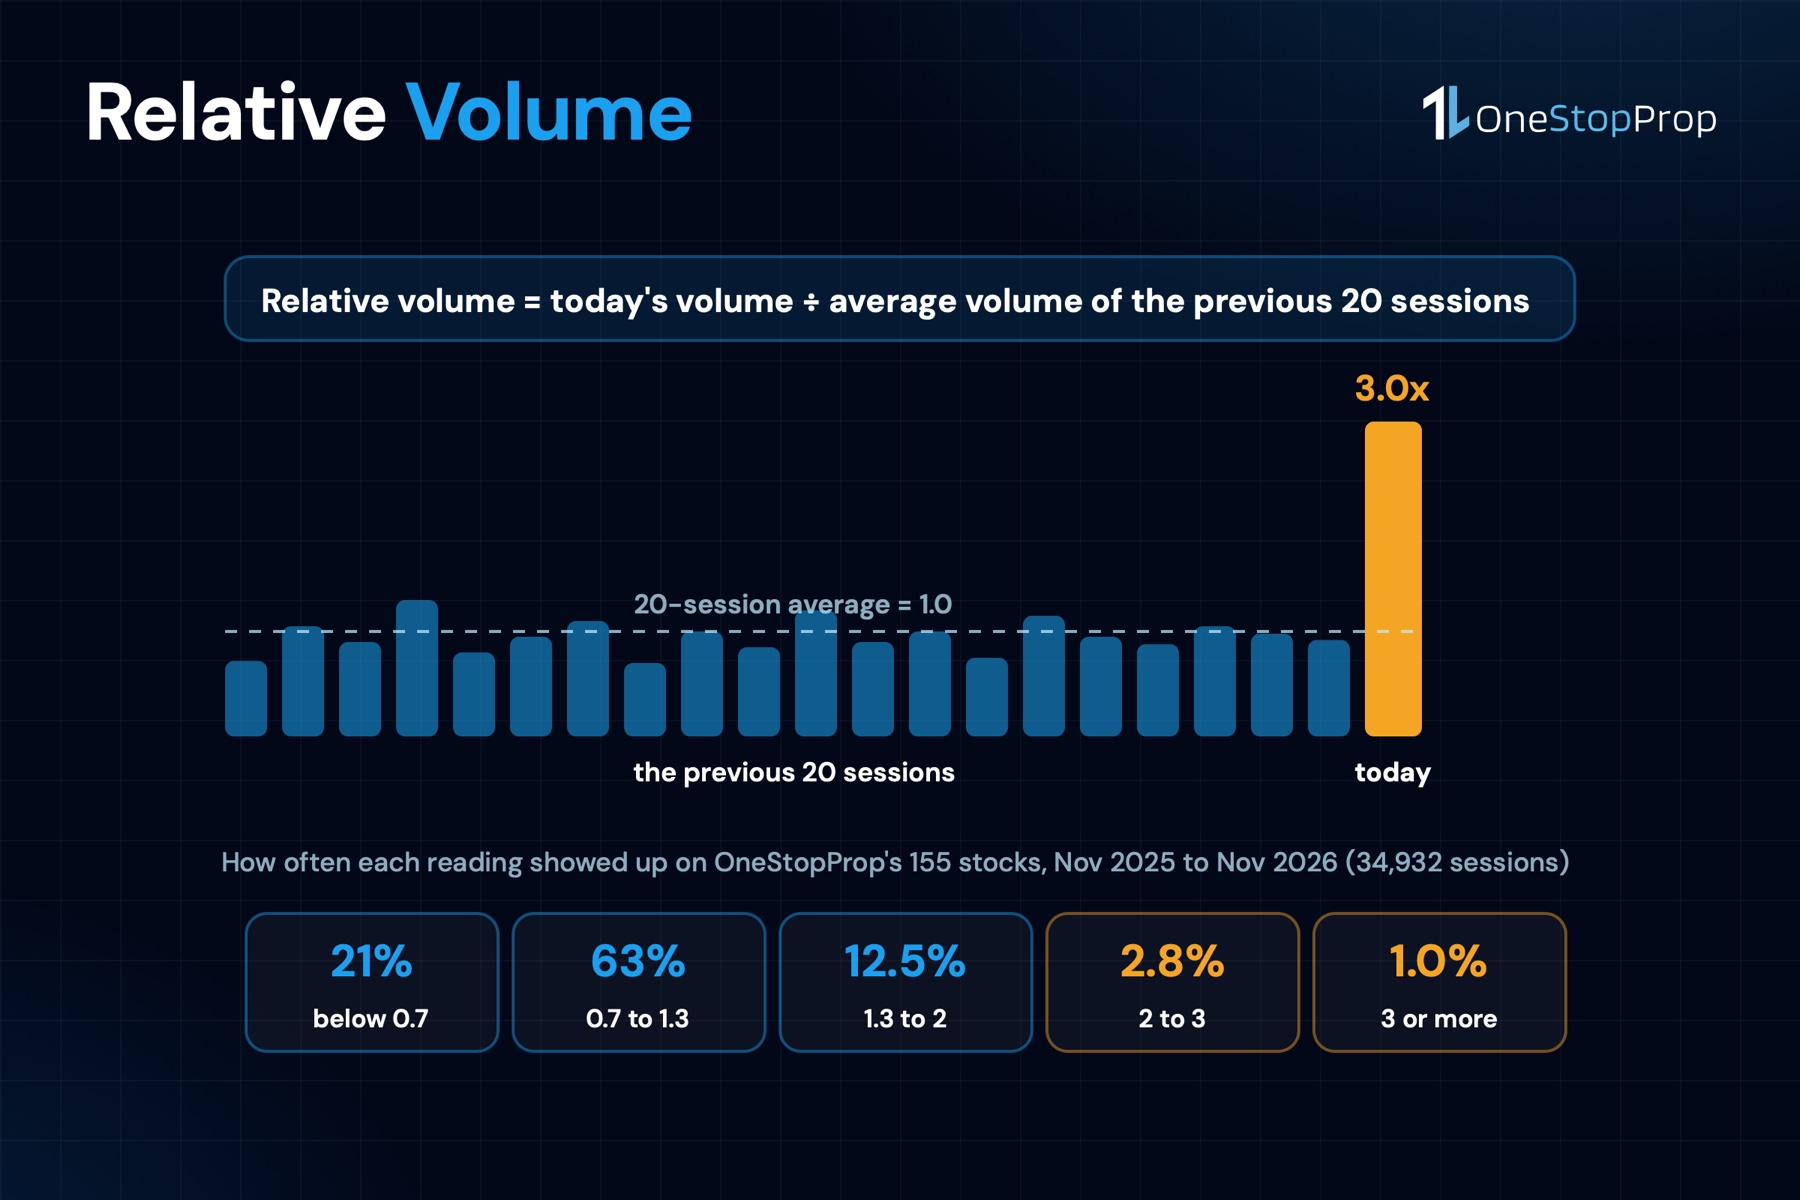
Relative volume is today’s volume divided by the volume the stock usually trades. A reading of 1 is a normal day. A reading of 3 is a stock doing 3 times its usual business, and every scanner, watchlist and premarket routine leans on that number to decide what is “in play” before the bell rings.
What the number is worth is a different question, and it has an answer. This guide took 2 years of daily candles on the 155 U.S. stocks on OneStopProp’s instrument list, computed relative volume for every session in the last 12 months, 34,932 of them, and measured what the high-volume days actually did: how far they moved, how much of the move was already in the opening gap, what the next day looked like, and whether chasing a 3x volume day paid 5 sessions later.
Then it does the part that matters on a funded account: on a 3x day the stop has to be 3 to 4 times wider, and the position 3 to 4 times smaller, before any of the rest is worth discussing.
Key Takeaways
- Relative volume is a ratio, and 1 is normal. RVOL is the session’s volume divided by the average of the previous 20 sessions. On OneStopProp’s list the median session read 0.91. 3.8% of sessions reached 2x and 1.0% reached 3x: about 1 day in 26 and 1 day in 100.
- High relative volume predicts range, not direction. On RVOL 3+ sessions the median true range was 10.0% of the previous close, against 2.8% on a normal day, and 70% of them moved 3% or more. The next day continued the same direction 51% of the time. A coin.
- Most of the move was already in the gap. On 3x days that moved 3% or more, a median 64% of the close-to-close move was in the opening gap. What you see before the open is most of what you get.
- Chasing the 3x up-day lost money. After 110 sessions with RVOL 3+ and a close 3% or more higher, the stock was lower 5 sessions later 57% of the time, with a median 5-session move of 1.2% down.
- The stop is the problem. A 1-day-range stop on a $100 stock is $2.81 on a normal day and $10.02 on a 3x day. $500 of risk buys 177 shares on the first and 49 on the second.
What Relative Volume Is
Volume, in Nasdaq’s glossary definition, is the daily number of shares of a security that change hands between a buyer and a seller. Relative volume puts that number in context: it divides the session’s volume by the stock’s average volume over a lookback window, so a 20 million share day on a stock that averages 10 million reads 2.0, and the same 20 million on a stock that averages 40 million reads 0.5.
The lookback is a choice. This scan used the previous 20 sessions, about a trading month, which is the most common default. Some platforms use 10 or 50 sessions, and the number moves with it, so a reading quoted without its window is half a reading. TradingView’s public library lists dozens of relative volume indicators, and most of them let you set it.
Before the open, the version that matters is relative volume at time: the premarket volume so far, divided by what the stock usually has traded by that same clock time. A stock with 3 million shares at 9:00 AM when it usually has 500,000 is reading 6, and that is the number the premarket scanners sort by. It is also the number that cannot be measured from daily candles, so this guide measured the thing it points at: the full session’s relative volume, and what the day did.
How the Scan Measured It
The data is the daily open, high, low, close and volume of the 155 stocks on OneStopProp’s instrument list, from Nasdaq’s historical quotes, 2 years to November 3, 2026. 142 stocks had complete volume for the full period. For every session from November 3, 2025 to November 3, 2026 the scan computed:
- Relative volume: the session’s volume divided by the average volume of the previous 20 sessions.
- The bucket: below 0.7, 0.7 to 1.3 (normal), 1.3 to 2, 2 to 3, and 3 or more.
- The day’s range: the true range, from the higher of the high and the previous close to the lower of the low and the previous close, as a percentage of the previous close.
- The gap and the move: the open against the previous close, and the close against the previous close.
- What came next: the next session’s relative volume and direction, and the close 5 sessions later.
34,932 sessions went into the count. Here is what the buckets did.
What High Relative Volume Days Did
| Relative volume | Share of sessions | Median true range | Moved 3% or more | Gapped 2% or more | Next day, same direction | Next day’s RVOL |
|---|---|---|---|---|---|---|
| Below 0.7 | 21.1% | 2.36% | 6.6% | 5.8% | 49% | 0.70 |
| 0.7 to 1.3 | 62.6% | 2.81% | 16.0% | 9.2% | 49% | 0.92 |
| 1.3 to 2 | 12.5% | 3.92% | 35.6% | 18.3% | 48% | 1.16 |
| 2 to 3 | 2.8% | 5.75% | 51.9% | 34.7% | 52% | 1.34 |
| 3 or more | 1.0% | 10.02% | 70.1% | 56.8% | 51% | 1.64 |
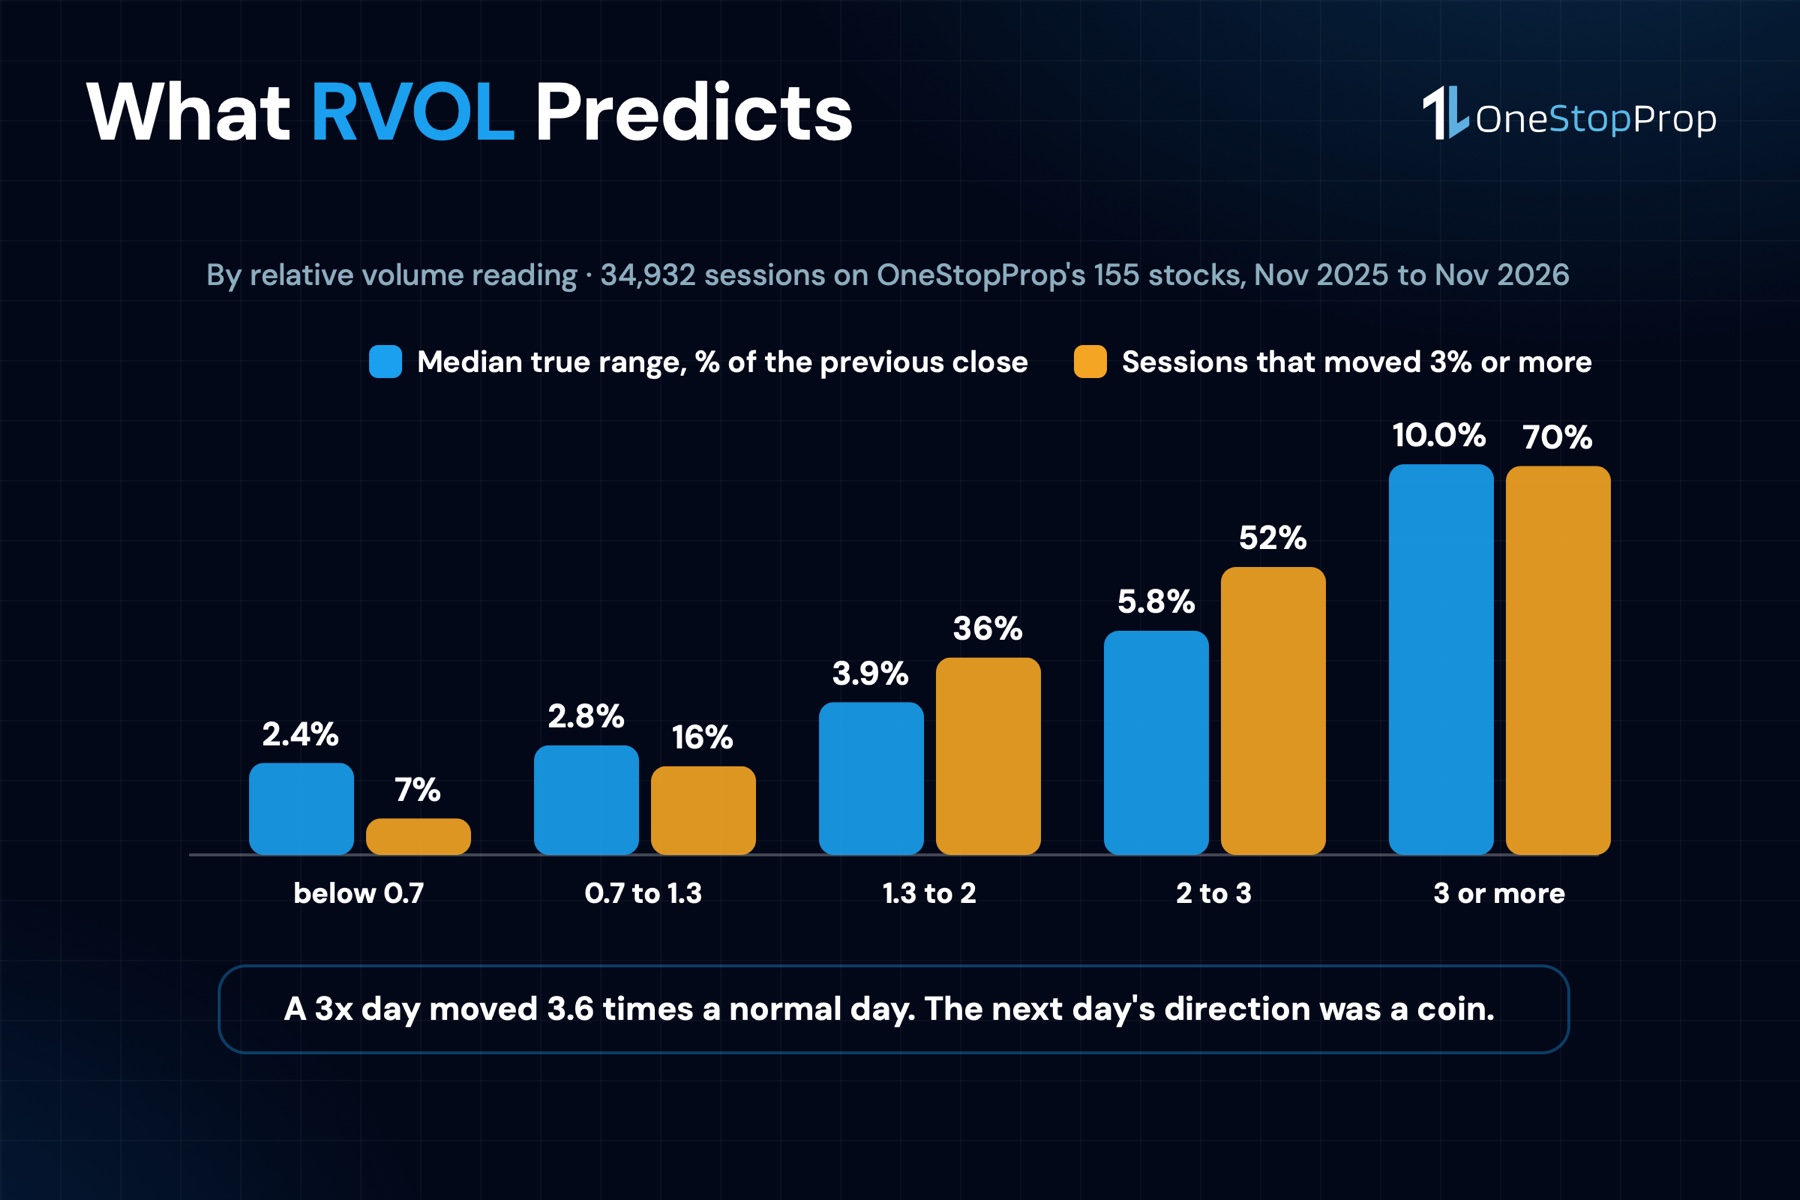
4 things to read out of that table.
Relative volume is a range forecast, and a good one. The median true range climbs with every bucket: 2.4%, 2.8%, 3.9%, 5.8%, 10.0%. A 3x day moved 3.6 times as much as a normal day, and 7 in 10 of them closed 3% or more away from the previous close. On a normal day, 1 in 6 did. If the question is “will this stock move today”, relative volume answers it.
It is not a direction forecast. The next session continued the same direction 48% to 52% of the time in every bucket, including the 3x days. Volume says the crowd showed up. It does not say which way the crowd leaves tomorrow.
The gap is most of the story. More than half of 3x days gapped 2% or more at the open. On the 253 sessions with RVOL 3 or more and a move of 3% or more, a median 64% of the close-to-close move was already in the gap. The day did keep going: 70% of those sessions closed beyond the open in the gap’s direction. But the trader who reads relative volume at 9:25 AM and buys at 9:30 is buying after 64% of the move.
The volume decays, slowly. The day after a 3x session read a median 1.64, the day after a 2x session 1.34. The range stays wide for a second day, which matters for the stop, and for the best time to day trade stocks on the session after the news.
Pro Tip: on a funded account, read relative volume as a stop-distance number first. Take the stock’s normal daily range, multiply it by the ratio the buckets show (about 2 times at RVOL 2, 3.6 times at RVOL 3), and divide that into your risk per trade before you look at the direction. If the share count comes out too small to matter, the day is too wide for the account, and no amount of volume changes that.
What Happened 5 Sessions After a 3x Day
This is the test of the premarket routine that buys what is in play and holds it.
| Session type | Count | Next day, same direction | Higher 5 sessions later | Median 5-session move | Median true range that day |
|---|---|---|---|---|---|
| RVOL 3+, closed up 3% or more | 110 | 49% | 43% | 1.19% down | 15.6% |
| RVOL 3+, closed down 3% or more | 143 | 55% | 47% | 0.47% down | 11.7% |
| RVOL 2 to 3, closed up 3% or more | 257 | 55% | 50% | 0.02% up | 8.9% |
| RVOL below 1.3, closed up 3% or more | 2,044 | 50% | 51% | 0.22% up | 5.4% |
The 3x up-day was the worst thing to chase. 110 sessions closed 3% or more higher on at least 3 times normal volume, and 5 sessions later the stock was lower 57% of the time, with a median move of 1.2% down. The median best high in those 5 sessions was 5.0% above the close and the median worst low 4.7% below it: a 15.6% range day followed by a 10% box, in both directions.
A 3% up-day on quiet volume, the kind no scanner flags, was slightly better: higher 51% of the time 5 sessions later, a median 0.2% up. The volume added range and took away edge. That is the opposite of what the premarket routine assumes, and it is the finding worth remembering.
3 Real Days at 3x Volume
Every price from the daily data, with the 20-session average volume computed from the sessions before each day.
Palantir, August 4, 2026. Average volume over the previous 20 sessions: 36.1 million shares. Volume that day: 175.0 million, a relative volume of 4.85. The stock closed the day before at $125.65 and opened at $145.15, a gap of 15.5%, then ran to $164.52 and closed at $162.66, up 29.5%. The gap was 53% of the close-to-close move, and the true range was 30.9% of the previous close. The next day it closed at $158.43, down 2.6%, and 5 sessions later it was at $174.94, up 7.5%. The day before the gap, volume had already read 2.3 times normal.
Microsoft, July 30, 2026. Average volume 32.2 million, volume that day 110.2 million, a relative volume of 3.4. Previous close $390.54, open $437.90, a gap of 12.1%, high $458.69, close $451.10, up 15.5%. The gap was 78% of the move. The next session closed up another 3.0%, and 5 sessions later the stock was 10.8% higher. The follow-through happened here. It was 1 of the 43%.
Tesla, July 23, 2026. Average volume 39.0 million, volume that day 115.6 million, a relative volume of 3.0. Previous close $374.01, open $341.00, a gap of 8.8% down, low $315.74, close $319.69, down 14.5%. The gap was 61% of the move and the true range 15.6%. The next session closed down another 2.1%; 5 sessions later the stock was 3.4% below the close, at $307.44, after a 5-session low of $300.69.
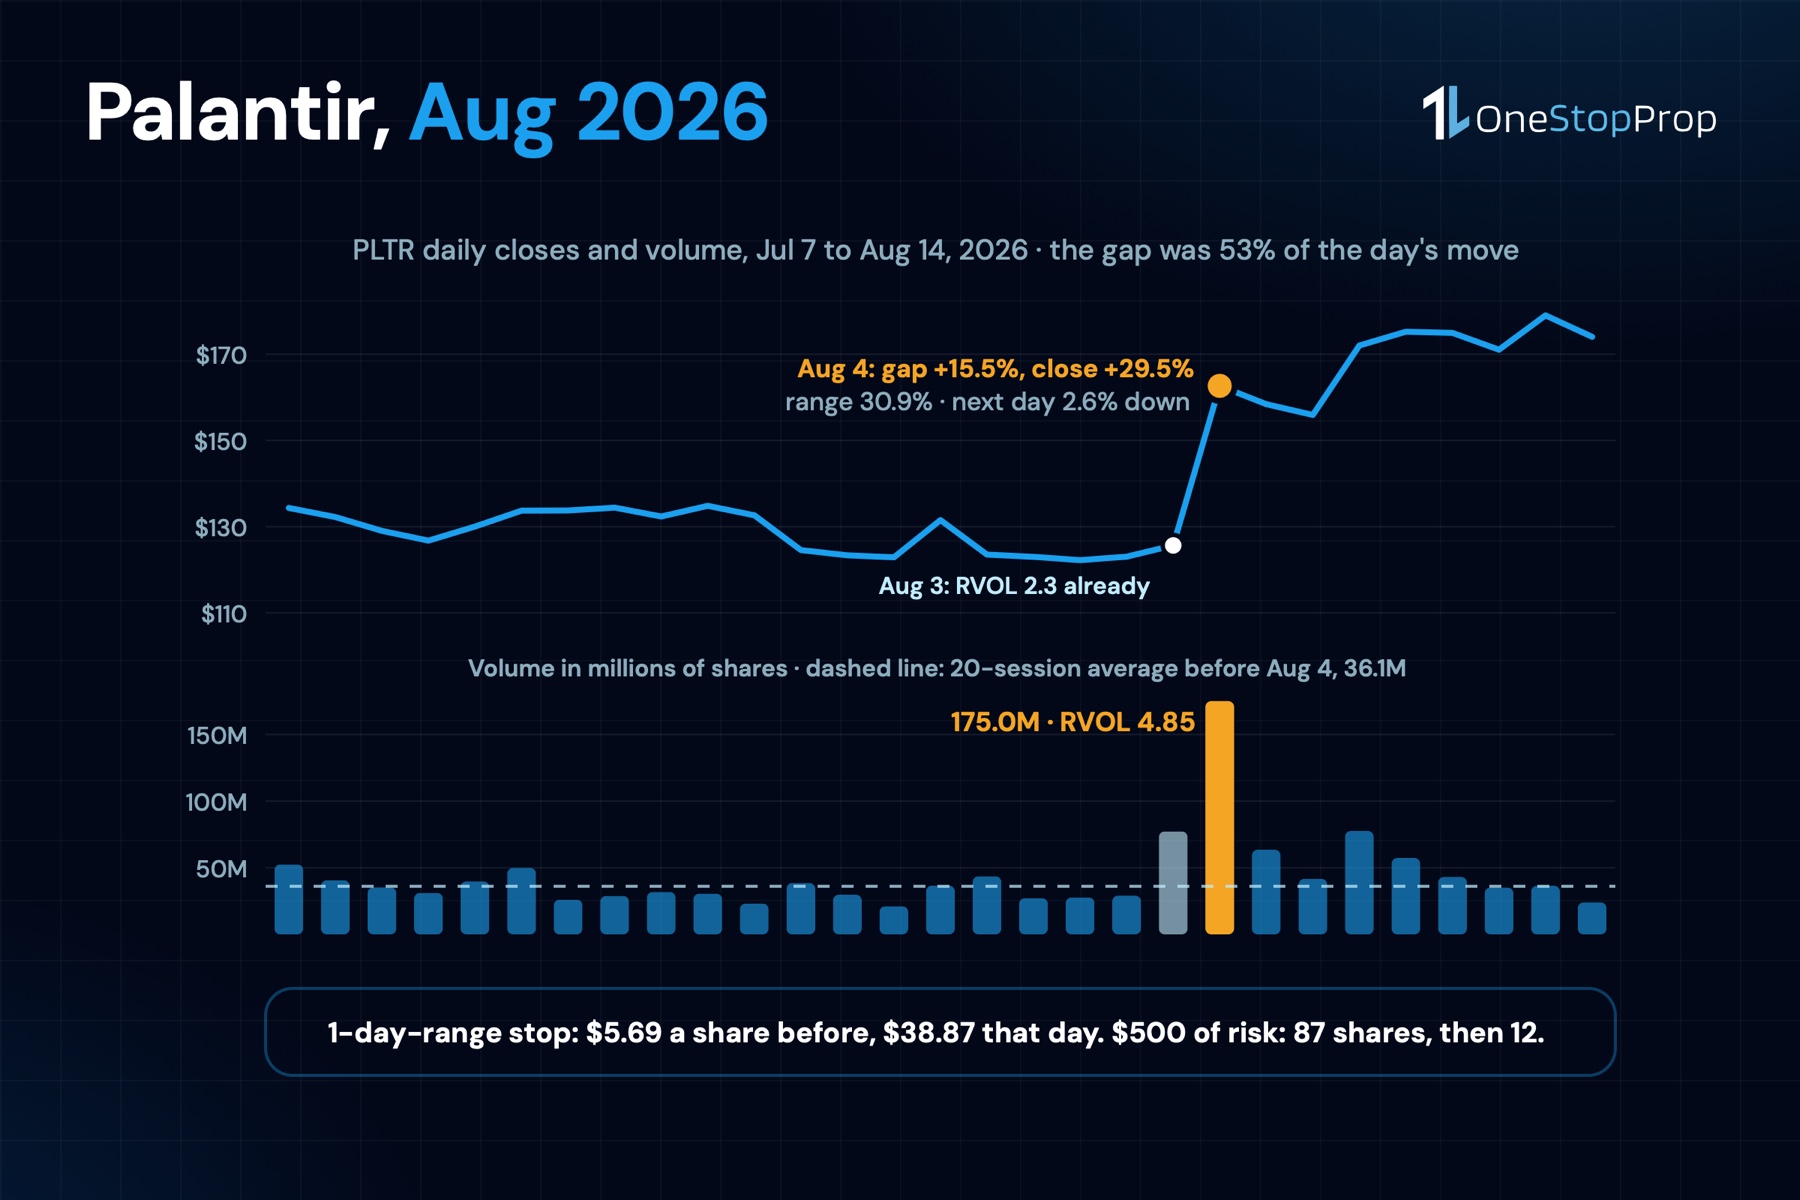
3 days, 3 readings above 3, 3 gaps that were 53% to 78% of the day’s move. 2 of them kept going the next day and 1 reversed. On the 20-session horizon that is a coin, and the count across 253 sessions says the same.
How to Read Relative Volume Before the Open on a Funded Account
The number is useful. The routine around it has to change.
1. Compute it against the right window. 20 sessions is the default this scan used; whatever your platform uses, know it. A reading of 2 against a 10-session window that already includes last week’s earnings day is a different animal from 2 against a quiet month.
2. Read the gap first. If the stock is reading 4 at 9:00 AM and is gapping 12%, 64% of the day’s move, on the median, is already on the screen. The question is not whether to buy the gap. It is whether the remaining 36%, with a 10% to 15% range around it, fits inside the account’s loss limit. The opening range breakout strategy guide has the structure for the first 30 minutes of a day like that.
3. Size from the range, not from the conviction. On a $100K 1 Step or 2 Step account the daily loss limit is 4% of the initial balance, $4,000, measured at 12:00 AM EST from the higher of balance or equity, per the Help Center’s maximum daily loss page. On Instant it is 2%. A stop that is 1 day’s range wide on a $100 stock is $2.81 on a normal day and $10.02 on a 3x day. At 0.5% risk, $500, that is 177 shares against 49. The trading plan template has the page for the arithmetic.
4. Expect the second day to be wide too. The session after a 3x day read 1.64 on the median. A stop set for a normal day on the morning after an earnings gap is a stop set for the wrong stock.
5. Mind the news window and the halt. On funded accounts every trade has to be closed 5 minutes before and after FOMC, NFP, CPI, PPI and stock earnings, unless the account carries the News Trading Allowed Add-On, and a 3x day that lands on one of those releases is inside that window. The trading earnings releases guide covers the window, and a stock that trades 5 times its normal volume is a stock that can be halted, which the trading halts guide shows fills at the reopen.
6. Do not hold the up-day for the follow-through. 57% of 3x up-days were lower 5 sessions later. If the trade is the gap’s continuation into the close, 70% of these closed beyond the open in the gap’s direction, and that is the trade. If the trade is the next week, the count says to take 1R and let a trailing stop loss decide the rest.
The Arithmetic of the 3x Day
The number from this scan that should change how a funded trader uses relative volume is 3.6, the ratio of a 3x day’s median range to a normal day’s. Here is what it does to the same $500 of risk on 3 account sizes, on a $100 stock with a stop 1 day’s range away.
| Account | Risk at 0.5% | Normal day, range $2.81 | 3x day, range $10.02 |
|---|---|---|---|
| $50K 2 Step | $250 | 88 shares, $8,800 | 24 shares, $2,400 |
| $100K 2 Step | $500 | 177 shares, $17,700 | 49 shares, $4,900 |
| $200K 2 Step | $1,000 | 355 shares, $35,500 | 99 shares, $9,900 |
The 3x day is the day every scanner lights up, and it is the day the account can afford a quarter of the usual position. The risk reward ratio guide has the win rate each target multiple needs; at 49% for the next day’s direction, the edge on a high relative volume day has to come from the stop and the target, because the direction is not providing it.
Common Mistakes With Relative Volume
Reading it as a buy signal
It is a range signal. 51% of 3x days were followed by a same-direction day and 49% were not. The volume tells you the stock will move. It does not tell you where.
Buying the gap at the open
A median 64% of a 3x day’s move was already in the gap. The entry at 9:30 is an entry after most of the move, with the widest range of the year still to come.
Keeping the normal stop
A 3x day moved 3.6 times a normal day. The stop that fit yesterday is inside today’s noise, and the position sized for yesterday’s stop is 3 to 4 times too big for today’s.
Holding the up-day for the follow-through
The 3x up-day was lower 5 sessions later 57% of the time. The quiet 3% up-day was higher 51% of the time. The volume added range, not edge.
Quoting the number without the window
A 10-session window and a 50-session window give different readings for the same day. A scanner column that does not say which one it uses is sorting by a number you cannot check.
Frequently Asked Questions
What is relative volume?
The session’s volume divided by the stock’s average volume over a lookback window, usually 20 sessions. A reading of 1 is a normal day, 2 is twice normal, 0.5 is half. On OneStopProp’s list the median session read 0.91, 3.8% of sessions reached 2 and 1.0% reached 3.
What is a good relative volume for day trading?
Depends on what “good” means. For range, 2 or more: the median true range went from 2.8% on a normal day to 5.8% at RVOL 2 to 3 and 10.0% at 3 or more. For direction, no reading helped: the next day continued the same way 48% to 52% of the time in every bucket.
How do you read relative volume before the market opens?
Premarket platforms compare the volume traded so far with what the stock usually has traded by the same clock time, which is relative volume at time. Read it with the gap: on 3x days that moved 3% or more, a median 64% of the day’s move was in the opening gap, and 70% of them closed beyond the open in the gap’s direction.
Does high relative volume mean the stock will go up?
No. On 3x sessions the next day was in the same direction 51% of the time, and after 3x up-days of 3% or more the stock was lower 5 sessions later 57% of the time. High relative volume means a wider range, not a direction.
How does relative volume affect position size on a funded account?
Through the stop. A 1-day-range stop on a $100 stock is $2.81 on a normal day and $10.02 on a 3x day, so $500 of risk buys 177 shares on one and 49 on the other. On a $100K 1 Step or 2 Step account the daily loss limit is 4% of the initial balance, 2% on Instant, and the wider stop is what keeps the 3x day inside it.
The Bottom Line
Relative volume is the best range forecast a trader gets before the open and the worst direction forecast. On 34,932 sessions, a 3x day moved 3.6 times a normal day, gapped most of it, continued the gap into the close 70% of the time, and then went nowhere in particular: the next day was a coin, and the 3x up-day was lower a week later more often than not.
Used the way the scanners suggest, as a list of stocks to buy at the open, it is a list of the widest stops of the month. Used the way the numbers suggest, as the multiplier on the stop and the divisor on the size, it is the number that lets a funded trader be in the day’s most active stock without the day being the account’s last.
If you want to run that version on an account where the daily and total loss limits are written down before the first premarket scan, start a funded account at OneStopProp: 1 Step, 2 Step or Instant, from $10K to $300K, with U.S. stock CFDs on the same list this scan used and no time limit on the challenge.
Sources
- Volume, Nasdaq glossary. The daily number of shares of a security that change hands between a buyer and a seller. https://www.nasdaq.com/glossary/v/volume
- Historical Quotes, Nasdaq. Daily open, high, low, close and volume for the 155 stocks on OneStopProp’s instrument list, 2 years to November 3, 2026, used for the scan and the PLTR, MSFT and TSLA examples. https://www.nasdaq.com/market-activity/quotes/historical
- Relative volume indicators, TradingView public script library. The indicators most traders use to read RVOL, with the lookback window as a setting. https://www.tradingview.com/scripts/relativevolume/
- What Instruments Can I Trade?, OneStopProp Help Center. The U.S. stock CFD list the scan covered. https://help.onestopprop.com/faq/what-instruments-can-i-trade/
- What is the Maximum Daily Loss?, OneStopProp Help Center. 4% of the initial balance on 1 Step and 2 Step, 2% on Instant, measured at 12:00 AM EST. https://help.onestopprop.com/faq/what-is-the-maximum-daily-loss/
- Is news trading allowed?, OneStopProp Help Center. The 5-minute window around FOMC, NFP, CPI, PPI and earnings on funded accounts, and the News Trading Allowed Add-On. https://help.onestopprop.com/faq/is-news-trading-allowed/
- What happens during halts or abnormal trading conditions?, OneStopProp Help Center. https://help.onestopprop.com/faq/what-happens-during-halts-or-abnormal-trading-conditions/