Most advice about the risk reward ratio stops at “aim for 1:2”. That is not advice, it is a slogan. On a funded account the risk reward ratio is not a preference, it is the variable that decides whether your win rate is good enough to pass at all.
Here is the arithmetic, worked against a real profit target and a real daily loss limit, so you can see which combinations reach the target and which ones mathematically cannot.
Key Takeaways
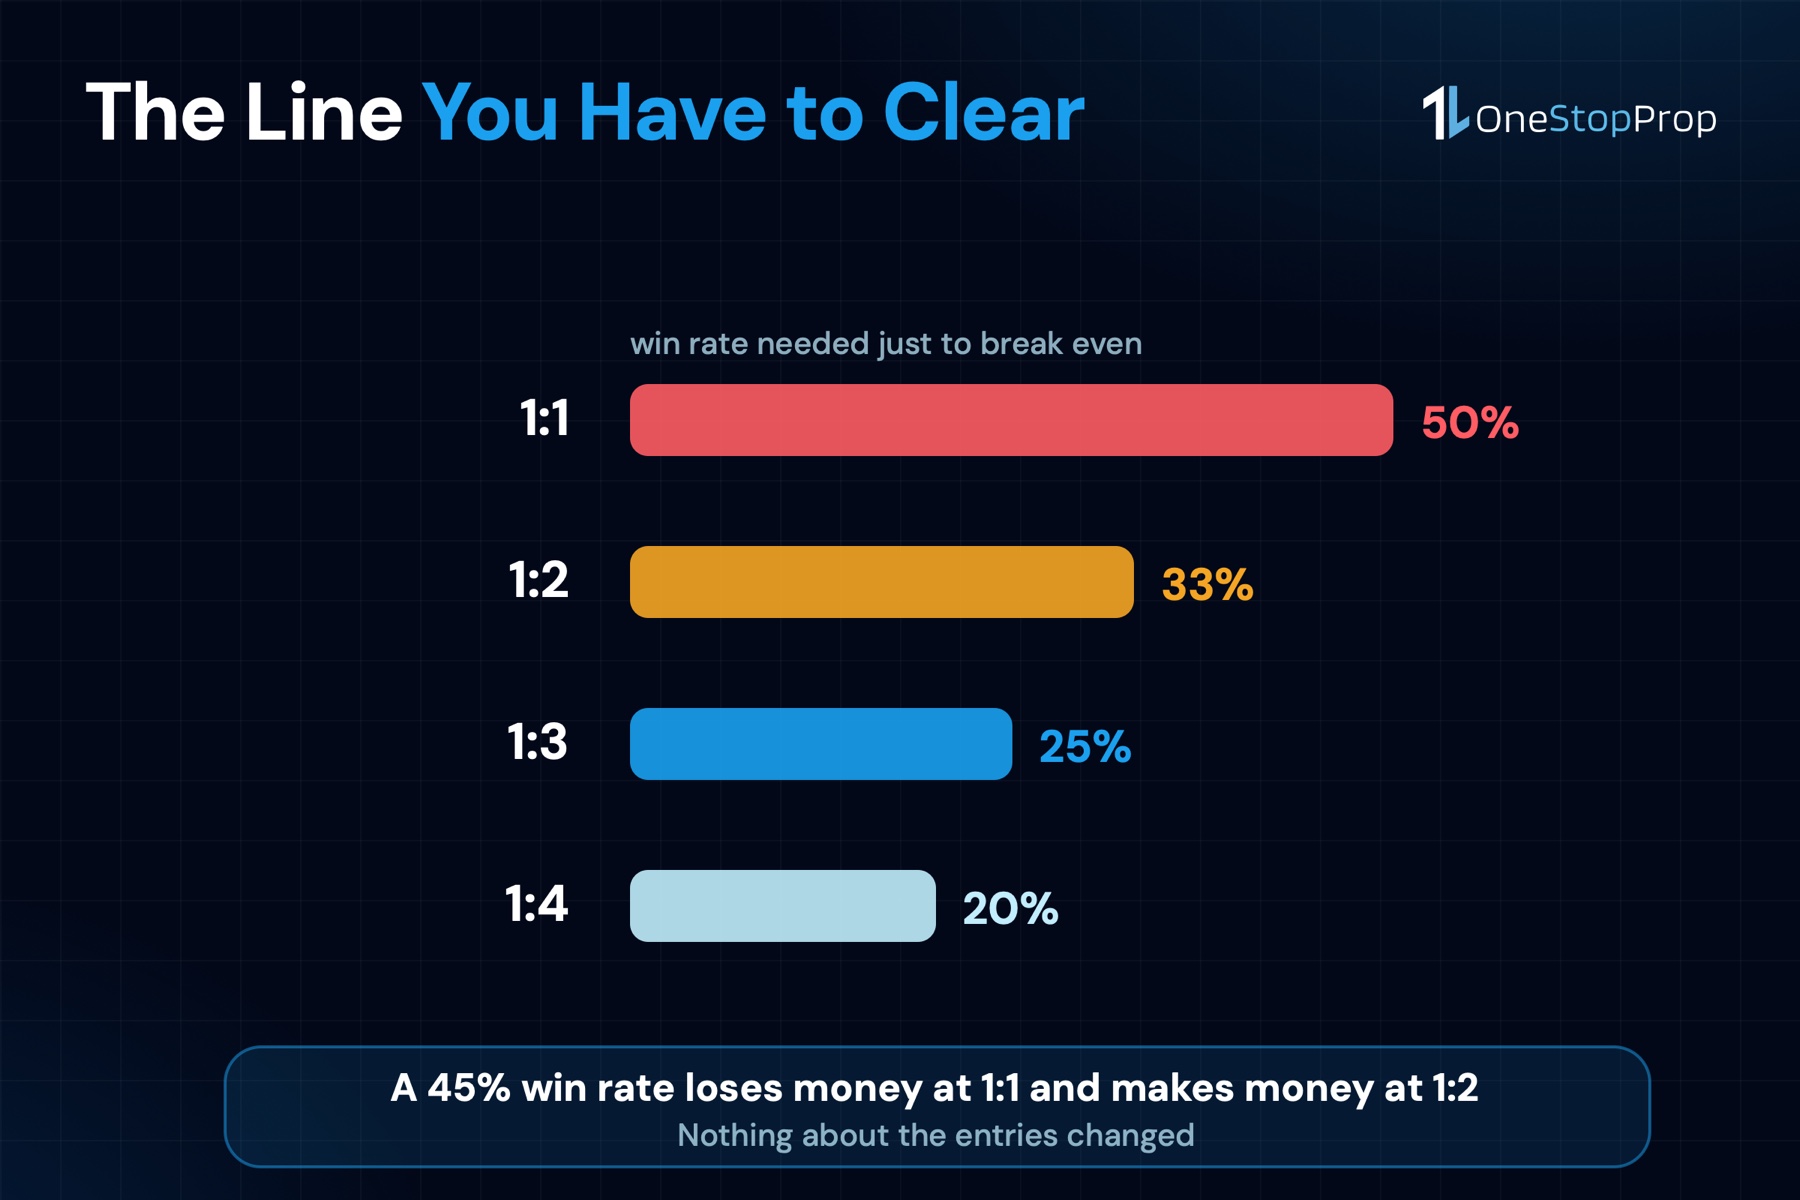
- The risk reward ratio sets the win rate you need to break even. At 1:1 you need 50%. At 1:2 you need 33%. At 1:3 you need 25%. Below those numbers the strategy loses money no matter how disciplined you are.
- At 1:1, a 50% win rate goes nowhere. It is exactly breakeven, so the account drifts sideways while spread and slippage eat it. 1:1 only works above a 60% win rate, and that is rare.
- The ratio decides how many trades the challenge takes. Risking 0.5% per trade to reach an 8% target needs 80 trades at 1:2 with a 40% win rate, and 27 trades at 1:3 with the same win rate.
- A wider target is not free. Pushing from 1:2 to 1:3 usually lowers the win rate, because price has to travel further before it pays. The question is whether it falls below the breakeven line for the new ratio.
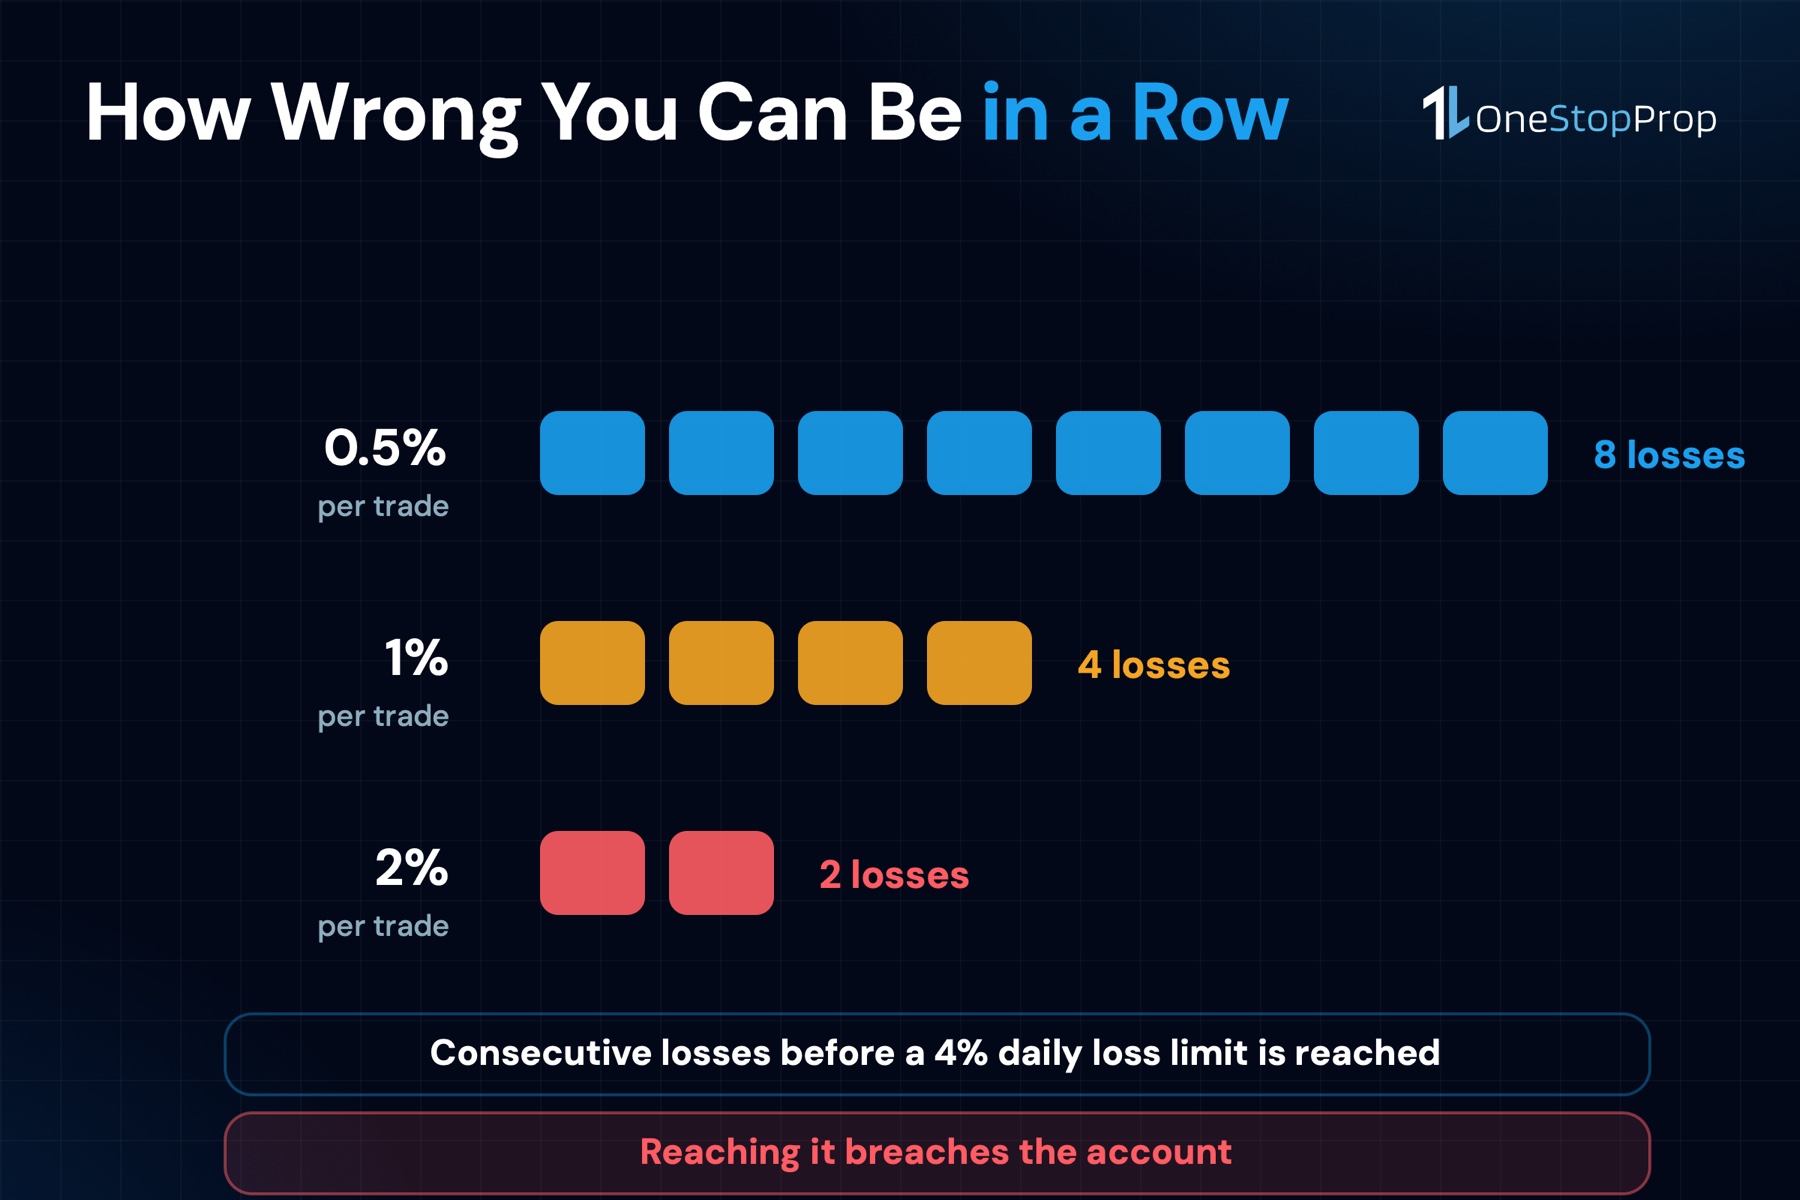
- The daily loss limit caps how wrong you can be in a row. On a $100K 1 Step or 2 Step account the limit is 4%. Risking 0.5% survives 8 consecutive losses; risking 1% survives 4.
What the Risk Reward Ratio Actually Measures
The risk reward ratio compares what you stand to lose on a trade against what you stand to make. Risk $200 to make $400 and the risk reward ratio is 1:2.
The risk reward ratio by itself says nothing about whether a strategy is good. It only becomes meaningful next to the win rate, because the 2 together produce expectancy: what the average trade is worth.
The formula is simple enough to do in your head.
Expectancy = (win rate x reward) – (loss rate x 1), expressed in units of risk.
A strategy that wins 40% of the time at 1:2 has an expectancy of (0.40 x 2) – (0.60 x 1) = 0.2. Every trade is worth 0.2 times whatever you risked. Risk $500 and the average trade earns $100, spread across wins and losses that look nothing like $100 individually.
The Break-Even Win Rate for Each Ratio
Before asking whether a strategy is profitable, find the line it has to clear.
| Risk reward ratio | Win rate to break even |
|---|---|
| 1:1 | 50% |
| 1:2 | 33% |
| 1:3 | 25% |
| 1:4 | 20% |
This is the single most useful table in trading, and it reframes the usual question. A trader with a 45% win rate is not a bad trader. At 1:1 they are losing money. At 1:2 they are comfortably profitable. Nothing about their entries changed.
It also explains why “improve your win rate” is often the wrong advice. Moving a win rate from 45% to 55% is hard and takes months. Moving a target from 1:1.5 to 1:2.5 is a decision you make before the trade.
How Many Trades the Challenge Actually Takes
Break-even is the floor. The real question on a funded account is how long the target takes, because every extra trade is another chance to breach the daily loss limit.
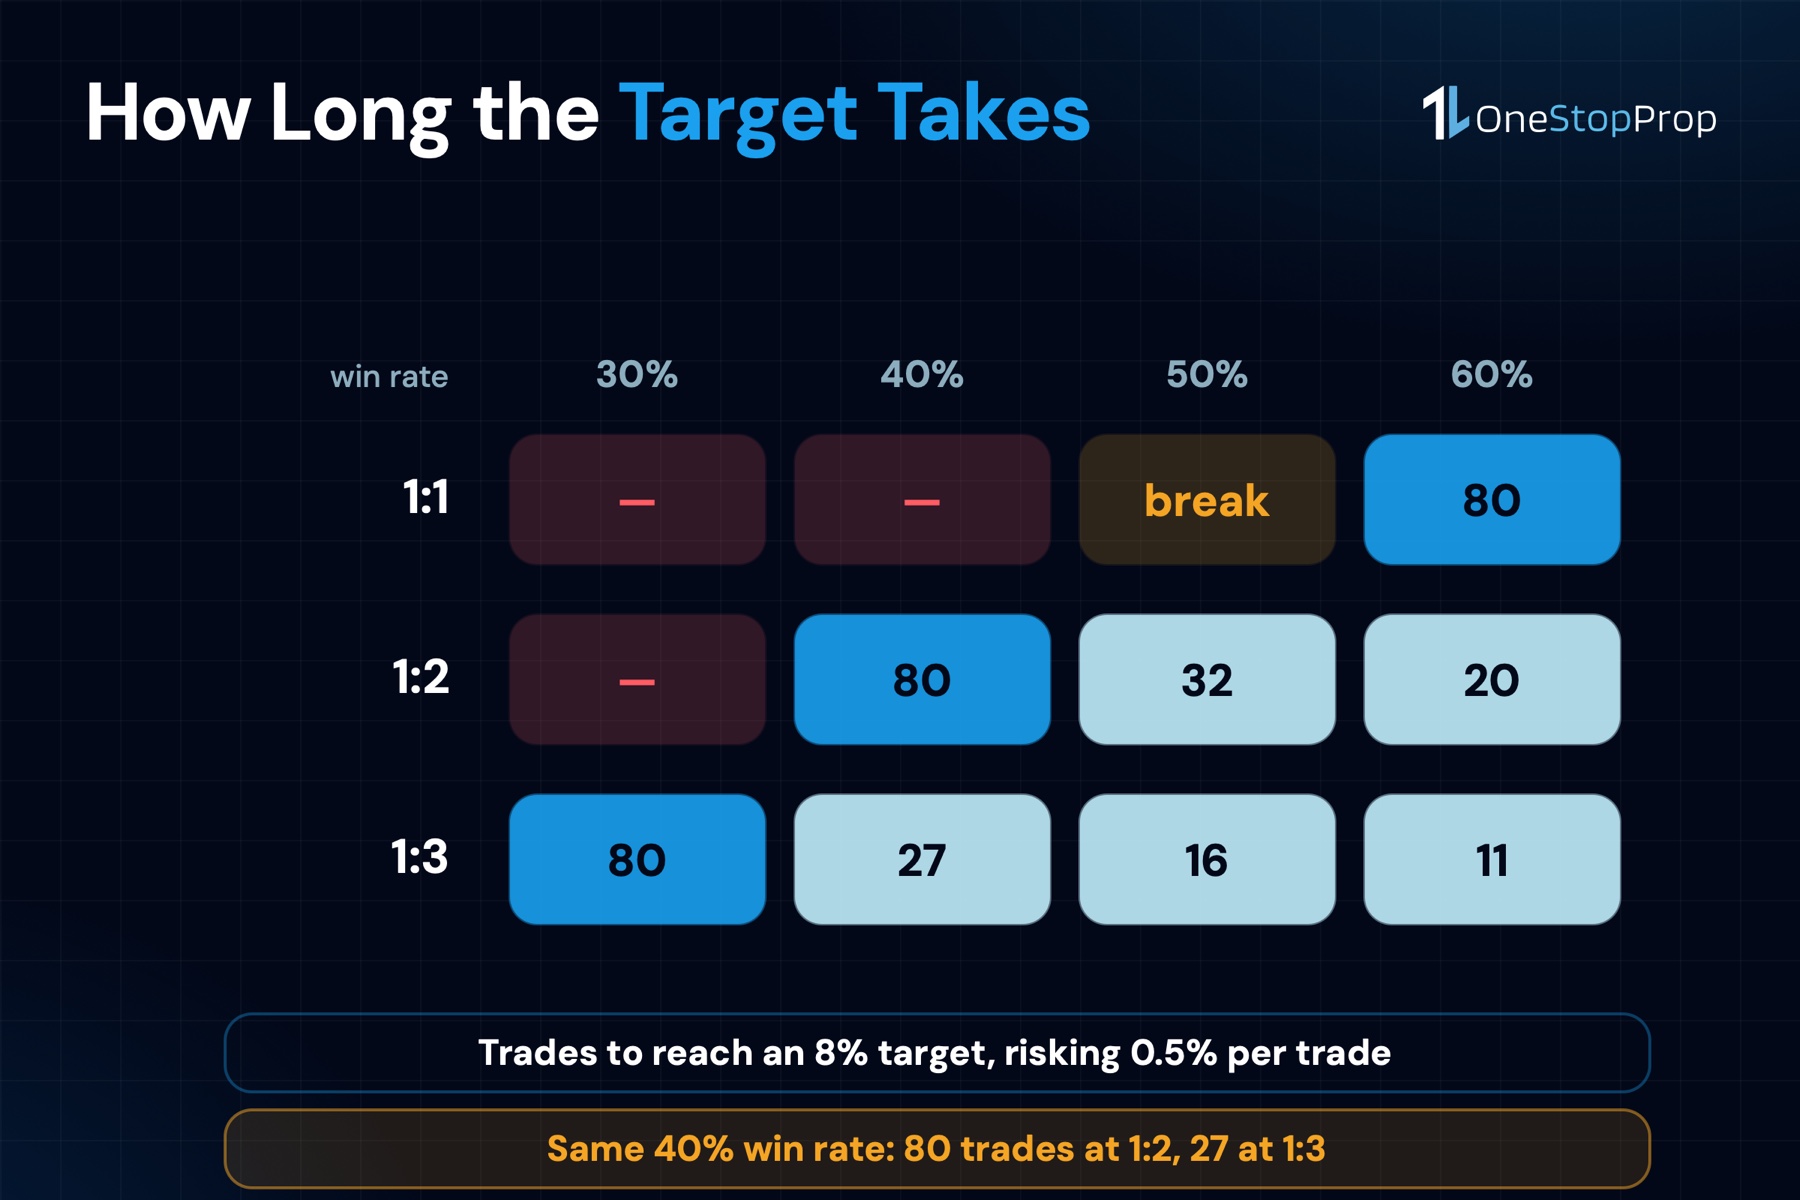
This is the number of trades to reach an 8% profit target, risking 0.5% of the balance per trade, at each combination:
| 30% win rate | 40% | 50% | 60% | |
|---|---|---|---|---|
| 1:1 | loses money | loses money | breakeven | 80 trades |
| 1:2 | loses money | 80 trades | 32 trades | 20 trades |
| 1:3 | 80 trades | 27 trades | 16 trades | 11 trades |
Read the diagonal and the lesson is clear. A 40% win rate at 1:2 needs 80 trades. The same 40% win rate at 1:3 needs 27. Same entries, same hit rate, a third of the work, purely from where the target sits.
And the trades you do not take matter as much as the ones you do. Every trade is an opportunity to lose, so a path that needs 80 of them exposes the account to the daily loss limit far more often than one that needs 27.
Pro Tip: before the challenge, count backwards. If your strategy produces 4 setups a week at 1:2 with a 40% win rate, 80 trades is 20 weeks. There is no time limit on a OneStopProp evaluation, which removes the deadline pressure, but it is worth knowing what you signed up for.
Where the Daily Loss Limit Comes In
Expectancy describes the long run. The daily loss limit decides whether you get to see it.
On a $100K account the limit is 4% of the starting balance on 1 Step and 2 Step, and 2% on Instant. Reaching it breaches the account. It does not pause until tomorrow.
That turns position size into a survival question rather than an optimisation one:
- Risking 0.5% per trade, 8 consecutive losses reach the 4% limit.
- Risking 1%, it takes 4.
- Risking 2%, it takes 2.
Now put that against the win rates above. A strategy with a 40% win rate produces a run of 4 losses more often than most traders expect: roughly once every 8 sequences of 4 trades. At 1% risk, that run ends the account. At 0.5% it is an ordinary bad day.
This is why the risk reward ratio and the position size have to be decided together. A 1:3 target with a stop so tight that it gets hit by noise is not a 1:3 strategy, it is a 1:3 plan with a 20% win rate, and that loses money.
Setting the Stop Where the Ratio Is Real
A risk reward ratio you wrote down is not one the market agreed to. The target has to be somewhere price can plausibly reach, and the stop has to be somewhere the trade is genuinely wrong.
Anchor the stop to the stock, not to a round number. A stop set at half the average daily range survives ordinary noise. On a stock that moves 2% a day that is about 1%; on a stock that moves 6% it is 3%. Using the same percentage stop on both is how a good ratio turns into a bad one.
Remember what the stop order does to the ratio. A stop order turns into a market order the moment the stop price trades, so you exit at the next available price, not the one you wrote down. On a fast move the ratio you realize is worse than the one you planned, which is one more reason the stop needs room in it.
Set the target at a level, not at a multiple. Take the distance to the next obvious level, divide by your stop distance, and that is your actual ratio on this trade. If it comes out at 1:1.2 on a strategy that needs 1:2, the trade does not qualify. Skipping it is the discipline the ratio is asking for.
Check the risk reward ratio before you enter, not after. The most common way a 1:3 plan becomes a 1:1 result is moving the target closer once the trade is open.
A Worked Example, Start to Finish
Numbers in a table are easy to agree with. Here is the risk reward ratio applied to a single trade, with every decision written down.
NVIDIA (NVDA) is trading at $237. The average daily range is 2.71%, so about $6.40 of movement between the day’s high and low. You want a long on a break above $238.
Step 1: place the stop where the trade is wrong. Half the average daily range is roughly $3.20, so the stop goes at $234.80. That is not a round number and it is not a feeling; it is the distance that normal movement will not reach by accident.
Step 2: find the target on the chart. The next clear level sits at $247.50. That is $9.50 above entry.
Step 3: read the risk reward ratio off those 2 numbers. $9.50 of reward against $3.20 of risk is 1:2.97, call it 1:3. Checking it this way, from levels rather than from a multiplier, is what keeps the risk reward ratio honest.
Step 4: size the position from the dollar risk. On a $100K account risking 0.5%, that is $500. At $3.20 of risk per share, the position is 156 shares, about $37,000 of exposure.
Step 5: check it against the daily limit. $500 is an eighth of the $4,000 daily loss limit on a 1 Step or 2 Step account. Even 3 losses like this leave the account well inside the rule.
If the target had come out at $241 instead, the risk reward ratio would be 1:1.25, and the trade would not qualify on a strategy that needs 1:2. Not taking it is not caution. It is the strategy doing its job.
When a Lower Risk Reward Ratio Is the Right Call
The table says wider is better, and most of the time it is. There are 2 situations where a lower risk reward ratio is the correct choice rather than a lazy one.
When the win rate is genuinely high and verified. A scalping strategy with a documented 65% win rate clears the break-even line at 1:1 with room. The condition is that the win rate comes from your own records across at least 50 trades, not from an impression.
When the hold time is the constraint. A 1:3 target on an intraday strategy may need 3 hours to reach. If your rules close everything before the final hour, the ratio you planned is not the ratio you will get, and a realistic 1:1.5 that actually fills beats a theoretical 1:3 that gets closed early.
What is never a reason: taking a lower ratio because the trade looks good. That is how a 1:2 strategy quietly becomes a 1:1 strategy with the same win rate, which is the one combination the table says loses money.
Common Mistakes With Risk Reward on a Funded Account
Using a Ratio the Strategy Cannot Support
Picking 1:4 because the table says you only need a 20% win rate works right up until the win rate falls to 15%. Wider targets get hit less often. The ratio and the win rate move together, and the only pair that matters is the one your own trades actually produce.
Widening the Stop to Save a Trade
Moving a stop further out does not reduce the loss, it increases it and destroys the ratio at the same time. A trade entered at 1:2 and managed to 1:0.7 has quietly become a strategy that needs a 59% win rate.
Averaging the Ratio Across Different Setups
A breakout at 1:3 and a mean-reversion trade at 1:1.2 do not average into a 1:2 strategy. They are 2 strategies with 2 different break-even win rates, and blending them hides that one of them loses money.
Ignoring Costs
Spread and slippage come out of the reward side of every trade. On a 1:1 strategy near breakeven, costs alone decide the outcome. The SEC puts the same idea plainly for day traders: know up front how much you need to make to cover expenses and break even. The wider the risk reward ratio, the less costs matter, which is another quiet argument against 1:1.
Frequently Asked Questions
What is a good risk reward ratio for stock trading?
1:2 is the common default and it is a reasonable floor, because it only needs a 33% win rate to break even. What makes a ratio good is whether your strategy’s actual win rate clears the break-even line for it: 50% at 1:1, 33% at 1:2, 25% at 1:3. A 1:3 strategy with a 20% win rate is worse than a 1:2 strategy with 40%.
Can I pass a prop firm challenge with a 1:1 risk reward ratio?
Only with a win rate above 50%, and in practice above 55% once costs are included. At exactly 50% a 1:1 strategy is breakeven before spread. Reaching an 8% target at 1:1 needs a 60% win rate and around 80 trades at 0.5% risk, which is a lot of exposure to the daily loss limit.
How do I calculate my risk reward ratio?
Divide the distance from entry to target by the distance from entry to stop. Entry at $100, stop at $98, target at $106 is a $2 risk against a $6 reward, so 1:3. Do it before entering, using levels you can point to on the chart rather than round numbers.
Does a higher risk reward ratio mean fewer trades?
To reach a fixed profit target, yes. Risking 0.5% per trade to make 8%, a 40% win rate needs 80 trades at 1:2 and 27 at 1:3. Fewer trades also means less exposure to the daily loss limit, which on a funded account matters as much as the profit.
How does the daily loss limit affect my risk per trade?
It caps how many losses in a row you can survive. A 4% daily loss limit on 1 Step and 2 Step allows 8 consecutive losses at 0.5% risk per trade, or 4 at 1%. Pick the risk per trade from how long your strategy’s losing streaks actually run, not from how confident you feel.
Should I change my risk reward ratio during a challenge?
Changing the target mid-challenge usually means changing strategy mid-challenge, which makes the results unreadable. The better move is to decide the risk reward ratio before the first trade, based on the win rate your own records show, and then leave it alone.
The Bottom Line
The risk reward ratio is not a style choice. It is the number that decides which win rates are viable, how many trades the target takes, and how much exposure to the daily loss limit you accept along the way.
Find your real win rate from your own records. Read the break-even line for the risk reward ratio you want. If your win rate does not clear it, the fix is the ratio or the entries, not more discipline.
If you want to put that math against a defined target, OneStopProp runs 1 Step and 2 Step routes from $10K to $300K with no time limit on the evaluation, so the number of trades your strategy needs is a plan rather than a deadline.
Sources
- What is the Maximum Daily Loss?, OneStopProp. The daily loss limit on each route, and how it is calculated. https://help.onestopprop.com/faq/what-is-the-maximum-daily-loss/
- Payout Rules, OneStopProp Help Center. Targets, minimum trading days and the rules that apply once funded. https://help.onestopprop.com/faq/payout-rules/
- Funded Account Trading: How It Works, OneStopProp. The routes, their targets and what happens after you pass. https://onestopprop.com/funded-account-trading/
- Most Volatile Stocks to Day Trade, OneStopProp. Average daily range by stock, for anchoring stop distance. https://onestopprop.com/most-volatile-stocks-day-trade/
- Stop Loss vs Stop Limit, OneStopProp. Which order type actually exits at the stop you planned. https://onestopprop.com/stop-loss-vs-stop-limit/
- Stop Order, Investor.gov, U.S. Securities and Exchange Commission. What a stop order becomes once the stop price is reached. https://www.investor.gov/introduction-investing/investing-basics/glossary/stop-order
- Day Trading: Your Dollars at Risk, U.S. Securities and Exchange Commission. Costs, leverage and the break-even a day trader has to clear. https://www.sec.gov/investor/pubs/daytips.htm