A trailing stop loss is a stop that follows the price up and never comes back down. You set a distance, in dollars or in percent, and the stop sits that far below the highest price the stock has reached since you entered. When the stock pulls back by that distance, the order fires and you are out.
The idea is simple. The numbers behind it are not, and most guides skip them. So this one measured them: 538 breakout entries on 143 of the U.S. stocks on OneStopProp’s instrument list, 12 months of daily data, 8 different exits run on the exact same trades.
Then it puts the result where it matters for a funded trader: next to the daily loss limit, the midnight snapshot and the news window, which decide what a trailing stop loss is actually worth on a funded account.
Key Takeaways
- A trailing stop loss only tightens. It moves up with the highest price since entry and stays put when the stock falls. When the stock pulls back by the distance you set, it becomes a market order.
- The exit does not create an edge, it shapes the losses. Across 538 entries every exit tested averaged within 0.5% of zero. What changed was the tail: a fixed 10% stop let 13.4% of trades lose more than 10% on gaps; a trailing 8% stop, 1.5%.
- Tight trails pay for their safety with whipsaws. A 5% trailing stop loss was hit on 92% of trades, with a median hold of 7 sessions, and 63% of those stops were followed by the stock closing back above the entry within 10 sessions.
- Size the distance to the stock’s daily range. Half the stocks on the list move more than 2.5% between their daily high and low. On the noisier half, a 5% trail was stopped on 99 of 100 trades.
- On a funded account, open profit held past midnight becomes tomorrow’s floor. The daily loss limit is measured at 12:00 AM EST from the higher of balance or equity. A trailing stop loss that has moved above your entry is the tool that keeps that profit from turning into a breach. The max total loss does not move: on a $100K 2 Step account it stays at $92,000 from day 1.
What a Trailing Stop Loss Is
A stop order, in the SEC’s definition, is an order to buy or sell a stock once its price reaches a specified price, the stop price, at which point it becomes a market order. The SEC’s Stop Order page adds the part most traders know by heart: a sell stop sits below the market to limit a loss or protect a profit on a stock you own.
A trailing stop loss is the same order with 1 change. The stop price is not fixed. It is defined as a distance below the highest price the stock has reached since you placed it, and the platform moves it up every time the stock makes a new high. It never moves down.
FINRA’s guide to order types describes the trailing version this way: the stop price trails the current price by either a number of points or a percentage the investor specifies, and the benefit is that you do not need to keep resetting the order as the shares rise. FINRA’s example is a 10% trail, the same figure tested below.
2 details decide how the order behaves when it fires.
- Trailing stop (market). When the stop price is touched, a market order goes out. You are out, at whatever the next price is. On a gap down, that price can be well below the stop.
- Trailing stop limit. When the stop price is touched, a limit order goes out instead. You will not sell below your limit, and you may not sell at all if the stock keeps falling. The stop loss vs stop limit guide works through that trade-off in detail.
Investor.gov’s page on types of orders states the disadvantage of any stop order in 1 sentence: a short-term fluctuation can activate it. With a trailing stop loss that disadvantage grows as the trail gets tighter, and the data below puts a number on it.
How a Trailing Stop Loss Moves, Day by Day
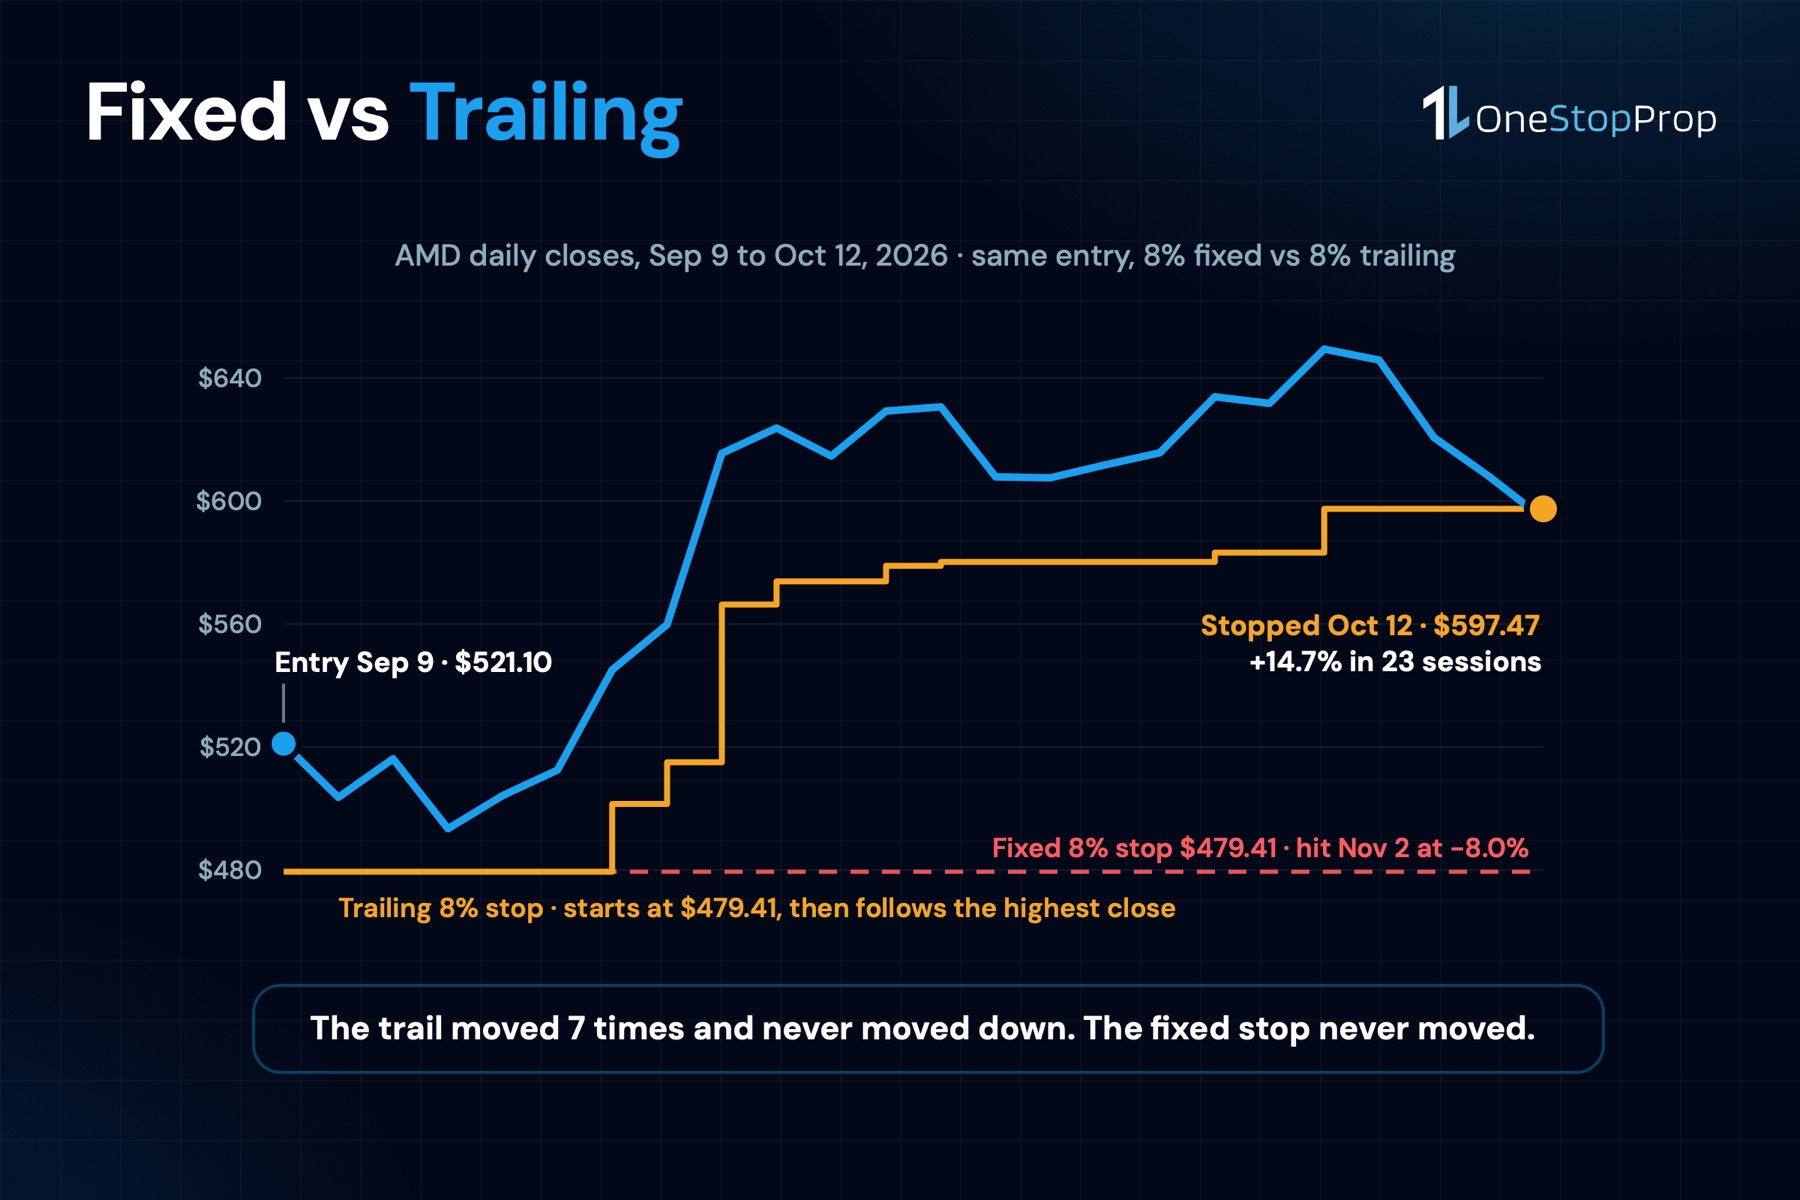
Here is a real one. AMD closed at $521.10 on September 9, 2026, above its highest high of the previous 20 sessions. Suppose you bought that close with an 8% trailing stop loss, which starts at $479.41.
- September 10 to 17. The stock dipped to a low of $480.33 on the 14th, 92 cents above the stop, and recovered. The stop did not move because no close was above the entry.
- September 18. A close at $559.82 lifted the stop to $515.03, already below nothing: the trade could no longer lose.
- September 22. Close $623.77, stop $573.87. The stop was now $52.77 above the entry.
- September 25. Close $630.63, stop $580.18.
- October 6. The highest close of the move, $649.42, put the stop at $597.47. That was its final level.
- October 12. AMD opened at $599.93, traded down to $586.54, and the stop fired at $597.47. Result: +14.7% in 23 sessions.
Now the same entry with a fixed 8% stop at $479.41. AMD kept falling after October 12 and hit $479.41 on November 2. Result: -8.0% in 38 sessions, on a trade that had been up 24.6% at the close of October 6.
Same stock, same entry, same 8%. The only difference is whether the stop was allowed to move.
What 538 Trades Say About Fixed vs Trailing Stops
The test used the daily candles of the stocks on OneStopProp’s instrument list, from Nasdaq’s historical data. 143 of the 155 stocks had 2 full years of data. The entry rule was mechanical: buy the first close above the highest high of the previous 20 sessions, 1 open trade per stock at a time, from November 3, 2025 to November 3, 2026. That produced 538 entries.
8 exits were run on every entry. 3 fixed stops, 3 percentage trails, and 2 trails set at a multiple of the 14-day average true range. Every exit also closed the trade after 40 sessions if nothing else had. Stops were checked against each session’s low, and a gap below the stop filled at the open, not at the stop.
| Exit | Stopped out | Median hold | Average result | Trades that lost more than 10% | Worst trade |
|---|---|---|---|---|---|
| Fixed 5% | 69% | 11 sessions | -0.10% | 1.3% | -14.8% |
| Fixed 8% | 50% | 24 sessions | +0.23% | 3.3% | -26.1% |
| Fixed 10% | 43% | 33 sessions | +0.03% | 13.4% | -26.1% |
| Trailing 5% | 92% | 7 sessions | -0.05% | 0.7% | -13.9% |
| Trailing 8% | 76% | 15 sessions | +0.33% | 1.5% | -26.1% |
| Trailing 10% | 64% | 19 sessions | +0.30% | 5.9% | -26.1% |
| Trailing 2 ATR | 96% | 8 sessions | -0.49% | 3.7% | -26.1% |
| Trailing 3 ATR | 84% | 15 sessions | -0.32% | 8.7% | -26.1% |
3 things to read out of that table before choosing a number.
No exit turned a flat entry into a winning system. Every average sits within half a percent of zero. A 20-session breakout bought at the close has no edge on this list over this year, and no stop can manufacture one. What the exit decides is the shape of the results: how much you lose when the trade fails and how much you keep when it works.
The fixed stop’s problem is the tail. A fixed 10% stop lost more than 10% on 13.4% of trades, 1 in 7, because the stock gapped through it. A trailing 8% stop had the same worst trade, -26.1%, but only 1.5% of trades lost more than 10%. On 408 trailing 8% stops, 11 filled more than 1% below the stop price. On 267 fixed 8% stops, 23 did.
The trailing stop’s problem is the whipsaw. A trailing 5% stop was hit on 92% of entries, and 63% of those stops were followed by the stock closing above the entry within 10 sessions. The order did its job, protecting the position, on a move that then reversed. At 10% the whipsaw rate fell to 42%; at a fixed 10% stop it was 16%.
What Each Exit Kept When the Trade Worked
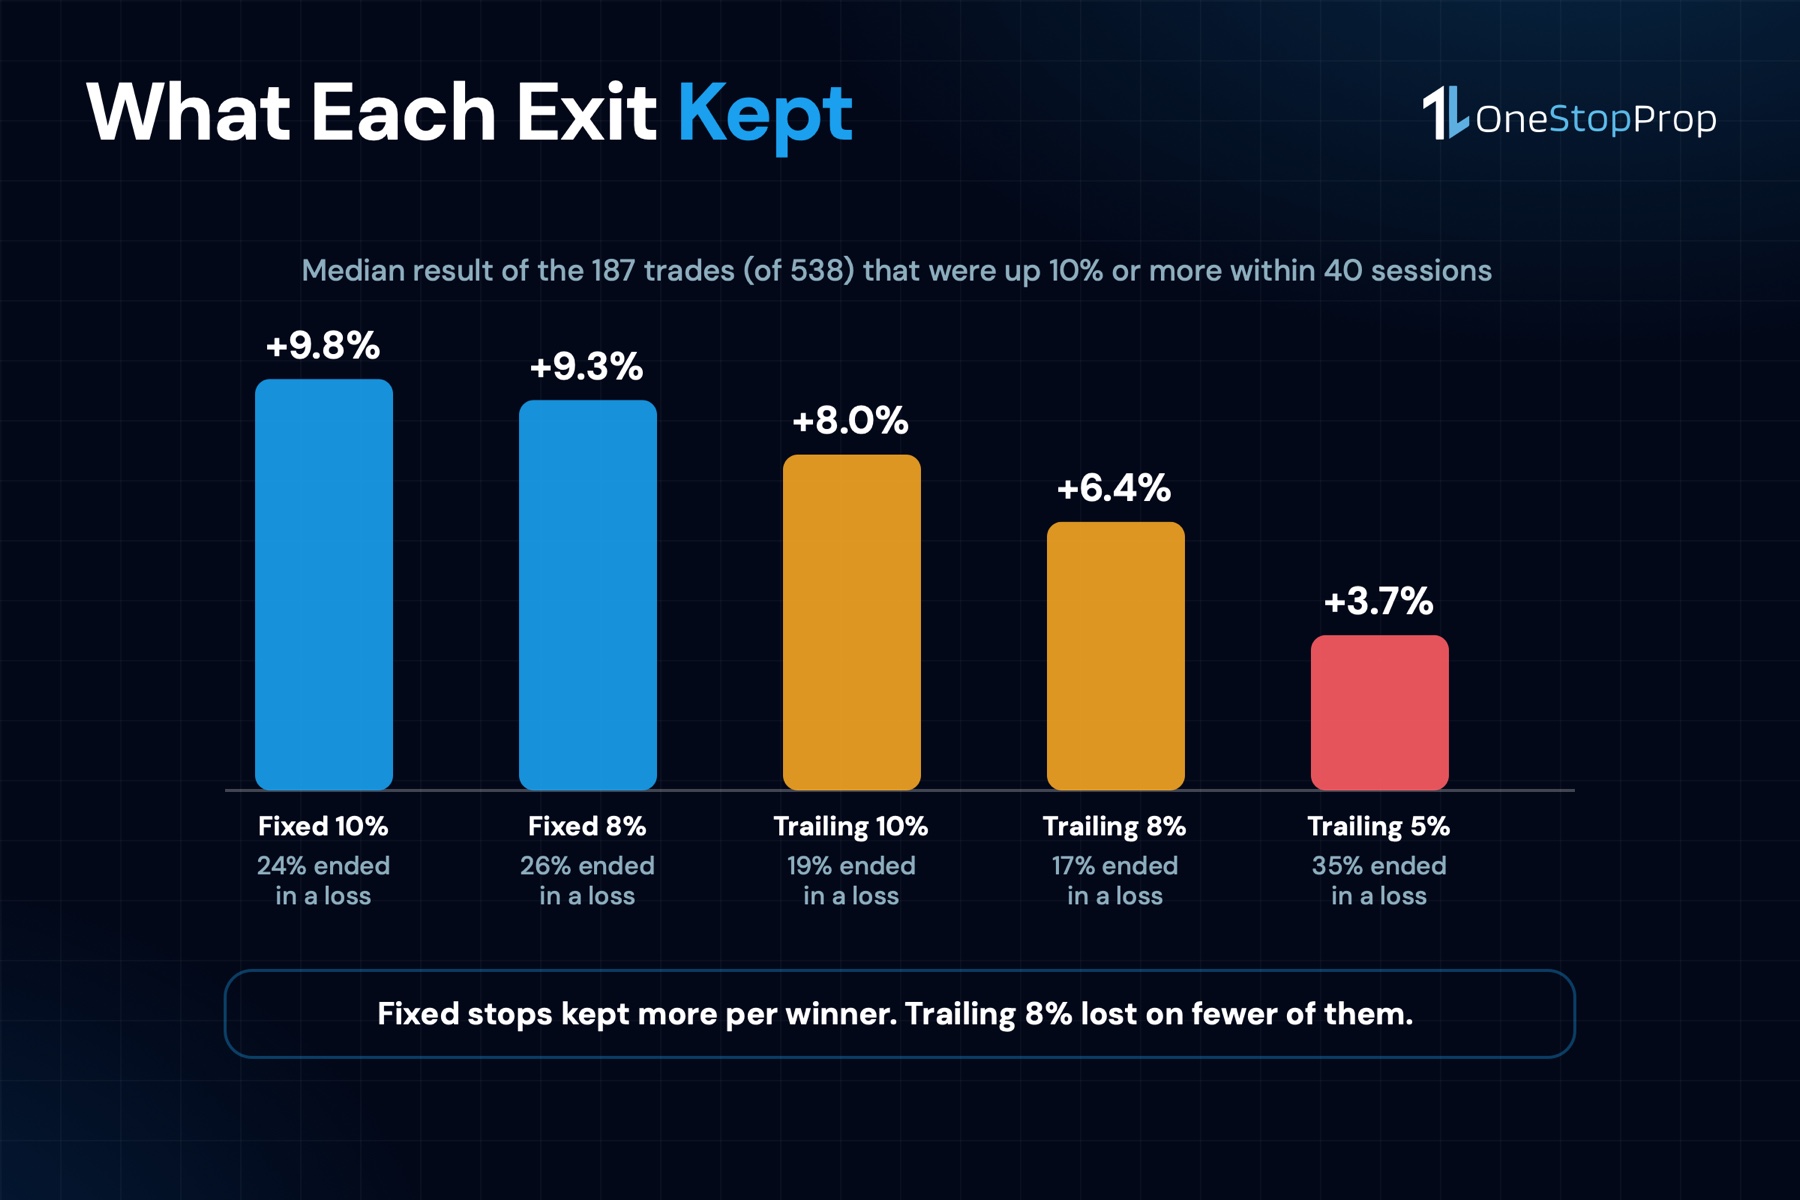
The table above mixes winners and losers. The more useful question for a trailing stop loss is what it does with a trade that actually goes somewhere. 187 of the 538 entries were up at least 10% at some point in the 40 sessions. Here is what each exit kept on those 187.
| Exit | Median result on the 187 winners | Ended in a loss anyway |
|---|---|---|
| Fixed 10% | +9.8% | 24% |
| Fixed 8% | +9.3% | 26% |
| Trailing 10% | +8.0% | 19% |
| Trailing 8% | +6.4% | 17% |
| Trailing 5% | +3.7% | 35% |
The fixed stops kept more of the median winner, because they held through pullbacks and let the 40-session clock close the trade. They also turned 1 winner in 4 into a loss, because when the move reversed there was nothing above the entry to catch it. The trailing 8% stop kept less on the median trade and turned 1 in 6 into a loss.
The 5% trail is the outlier on both counts. It kept the least and lost the most often, because a 5% pullback is a normal week for most of these stocks. Which brings up the number the trail has to be measured against.
The Trail Has to Clear the Daily Range
Every stock has a normal distance between its daily high and its daily low. Across the 142 stocks with usable data, the median of that daily range over the last 12 months was 2.55% of the close. 51 stocks had a median range above 3%, and 9 were above 5%: OKLO at 7.1%, HIMS at 6.3%, MRNA at 5.8%, MSTR at 5.5% and SMCI at 5.3% lead the list. At the calm end sit KO at 1.4%, MCD at 1.5% and PG at 1.6%.
A trailing stop loss set inside that range is a coin toss on a quiet day. The scan split the trades by the stock’s daily range, and the difference is not subtle.
| Stocks | Exit | Stopped out | Median hold |
|---|---|---|---|
| Daily range above 3% (178 trades) | Trailing 5% | 99% | 4 sessions |
| Daily range above 3% (178 trades) | Trailing 10% | 88% | 10 sessions |
| Daily range 3% or less (360 trades) | Trailing 5% | 89% | 10 sessions |
| Daily range 3% or less (360 trades) | Trailing 10% | 53% | 26 sessions |
On a stock that moves 4% between high and low on an ordinary day, a 5% trail is 1 ordinary day plus a little. CrowdStrike is the clean example. CRWD closed at $235.38 on September 14, 2026, a 20-session breakout. A 5% trailing stop loss started at $223.61, rose to $233.41 after the close of September 18, and was hit on the morning of September 21 when the stock opened at $231.62 and dipped to $230.85. That same session CRWD closed at $249.35, and on October 6 it closed at $278.86, 18.5% above the entry. The trail was tighter than 1 day of CRWD’s normal range, which was 4.07% over the year.
The working rule from this data: set the trail at no less than 3 times the stock’s median daily range. For a 2.5% stock that is about 8%. For CRWD or AMD, which both run above 4%, it is 12% or more, and that distance is what the next section sizes.
Pro Tip: before you set a trail on any stock, open the daily chart, read the last 20 candles, and write down the typical high-to-low distance. The most volatile stocks guide ranks the OneStopProp list by exactly that number. A trail you can read off a chart in 30 seconds beats a round number every time.
How a Trailing Stop Loss Works on a Funded Account
The order type is the same on a funded account as anywhere else. The rules around it are not, and 4 of them change what the order is for.
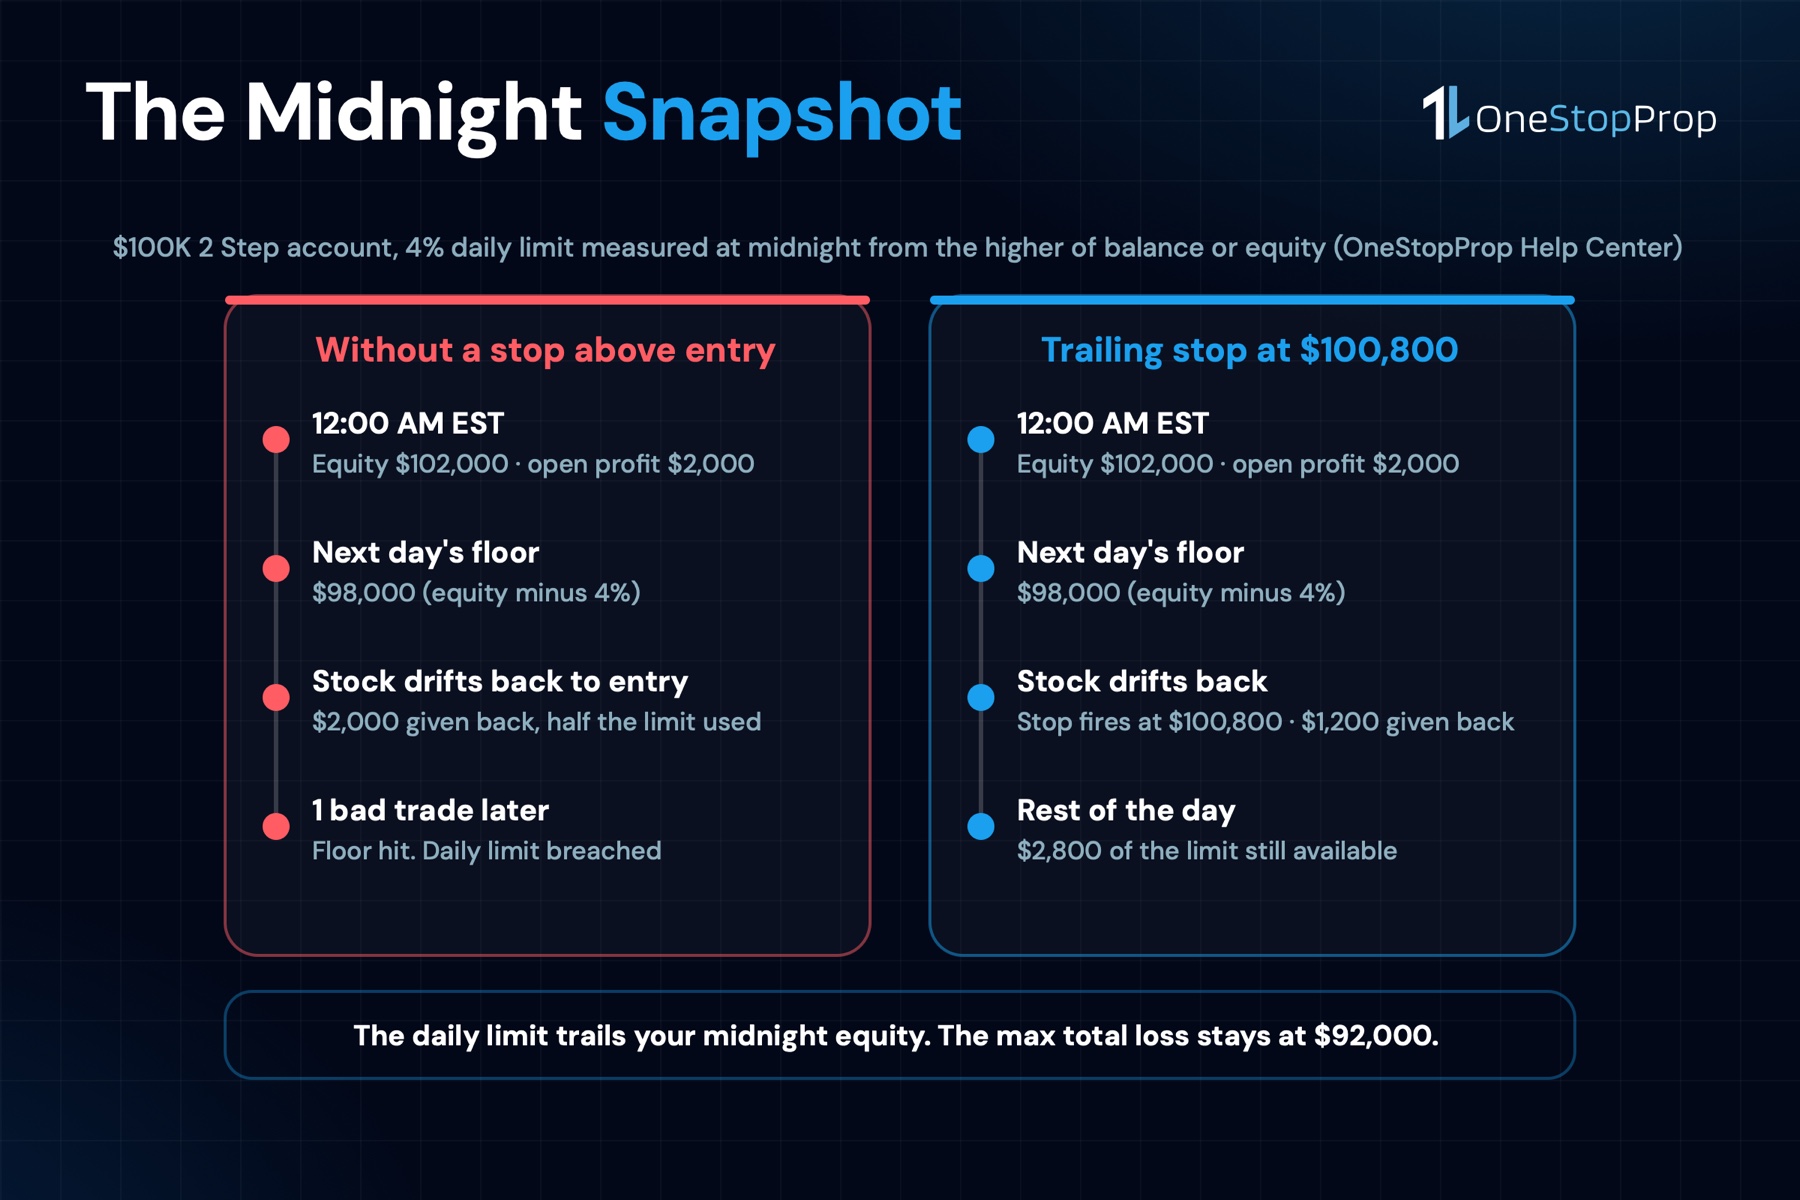
The daily loss limit is measured at midnight, from the higher of balance or equity. OneStopProp’s Help Center explains the maximum daily loss with an example: on a $100K account, if at 12:00 AM EST you have an open trade with a floating profit of $2,000, your equity is $102,000, and with a 4% daily limit your equity cannot drop below $98,000 the next day. The limit resets at 12:00 AM EST. It is 4% of the initial balance on 1 Step and 2 Step accounts and 2% on Instant. This is the only limit that trails your equity.
The max total loss does not trail. It is static. The Help Center’s max total loss page sets it at 6% on 1 Step, 8% on 2 Step and 5% on Instant, always of the initial balance, and measured on equity including open positions. On a $100K 2 Step account that is $92,000, and it stays at $92,000 whether you are up $2,000 or $20,000. So the 2 limits behave differently: the daily one moves up with your midnight equity, the total one is fixed on day 1 and never changes. A trailing stop loss earns its place against the limit that moves.
Read that example again from the trailing stop’s point of view. The $2,000 you are up at midnight is not a cushion. It is the top of tomorrow’s measuring stick. If the stock opens flat and drifts back to your entry, you have given back $2,000, and the account has used half of a $4,000 daily limit before you lost a cent of your own entry. On an Instant account, where the limit is $2,000, the same drift is a breach.
A trailing stop loss that has moved above your entry is what stands between that open profit and the floor. In the AMD trade above, the stop sat at $597.47 while the stock closed at $649.42. The $52 between them was the most that position could give back before it was closed, and every dollar of the $76 above the entry below that stop was locked.
Overnight holds are allowed, with no minimum holding time. The Help Center confirms you can hold overnight and over weekends and that there is no minimum holding time. So a trailing stop loss can ride a multi-week move like AMD’s 23 sessions, and the 40-session horizon in the test is realistic for the account.
The stop does nothing during a halt or inside the news window. A stop order cannot fill while a stock is halted; it fills at the reopen, wherever that is, as the trading halts guide shows. The Help Center also recommends closing positions during halts or abnormal conditions. And on funded accounts, all trades must be closed 5 minutes before FOMC, NFP, CPI, PPI and earnings releases, and none opened until 5 minutes after, unless the account has the News Trading Allowed Add-On. A trailing stop loss left open through that window is not protection; it is a position that is not supposed to be there.
The platform supports it. OneStopProp executes on Match-Trader with TradingView charts, as the Help Center’s platform page states. Match-Trader’s October 2025 release introduced a trailing stop loss that can be enabled when opening a position or added to an existing one, on desktop and mobile, with the stop level draggable on the chart. The Help Center’s list of supported orders names market, limit, stop loss and take profit. If the trailing option is not in your order form, you trail by hand: move the stop up after each close that makes a new high, and never down. It is the same rule with a 1-day delay.
Sizing a Trailing Stop Loss Inside the Daily Limit
The trail distance is also the initial stop distance, and that is what sets the share count. Take the AMD trade on a $100K 2 Step account, with a personal risk per trade of 0.5%, which is $500.
- Entry $521.10, trailing stop loss 8%, initial stop $479.41. Distance $41.69.
- Shares: $500 divided by $41.69, which is 11 shares, about $5,732 of stock as a CFD.
- If the first stop had been hit: 11 times $41.69, a $459 loss, 11% of the $4,000 daily limit.
- Actual exit at $597.47: 11 times $76.37, a gain of $840, 1.7 times the risk.
On a $100K Instant account the daily limit is $2,000, so the same proportion of risk is $250 and the position is 5 shares. The percentages are identical; the dollars halve. The risk reward ratio guide has the win rates each multiple needs, and the trading plan template has the page where the trail distance gets written down before the order.
Now the wider trail the daily-range rule asks for. AMD’s median daily range is 4.35%, so 3 times that is 13%. At a 13% trail the initial stop is $67.74 below $521.10, and $500 of risk buys 7 shares instead of 11. The trade is smaller, and it survives the pullback that stopped the 5% trail on September 14 at a 6.7% loss. A wider trail on a smaller position is the trade most funded traders should be making with this order.
5 Rules for Using a Trailing Stop Loss
- Measure the daily range first. 20 candles, high minus low, in percent. The trail is at least 3 times that number. If that makes the position too small to bother with, the stock is too noisy for a trailing stop loss at your risk level.
- Set the initial stop before the entry, and size from it. Risk per trade divided by the stop distance equals the share count. The trail starts there and only moves up.
- Move it only on closes, never on wicks. A stop that trails the intraday high gets dragged up by a spike and hit by the pullback from it. The test moved the stop on the highest close since entry, and so should you.
- Add a time exit. The test closed every trade after 40 sessions. A stock that has gone nowhere in 2 months is not building anything; it is capital that cannot work elsewhere.
- Know the 2 moments the order is blind. A halt, where it fills at the reopen, and the 5-minute news window on a funded account, where the position should already be closed.
Common Mistakes With a Trailing Stop Loss
Setting the trail at a round number
5% feels tight and 10% feels loose, and neither has anything to do with the stock. CRWD’s 5% trail lasted 5 sessions on a move that went 18.5% the right way. The number has to come from the stock’s range.
Trailing the high instead of the close
An intraday spike to a new high drags the stop up, and the normal retreat from that spike hits it. Trailing the close filters the spike. Every stop in this test moved on closes, and the whipsaw rates are already high enough.
Treating the stop as a floor for the daily limit
The daily limit is measured from midnight equity. If you are up $2,000 at midnight on a $100K 1 Step or 2 Step account, your floor is $98,000, and a stop sitting at your entry does not protect that limit. Only a stop that has moved above the entry does.
Using it on an earnings week
A trailing stop loss cannot fill through a gap, and on a funded account the position should be closed 5 minutes before the report anyway. The trading earnings releases guide covers what to do instead.
Expecting it to make the entry work
Every exit in this test averaged about zero because the entry had no edge. A trailing stop loss protects what an entry earns. It does not earn anything on its own.
Frequently Asked Questions
What is a trailing stop loss?
A trailing stop loss is a stop order whose stop price follows the stock up at a set distance, in dollars or percent, below the highest price reached since the order was placed. It moves up with new highs and never moves down. When the stock pulls back by that distance, the order becomes a market order and the position closes.
Is a trailing stop loss better than a fixed stop loss?
It changes the shape of the results, not the average. On 538 breakout trades, a trailing 8% stop and a fixed 8% stop both averaged within 0.4% of zero. The trailing stop cut the share of trades that lost more than 10% from 3.3% to 1.5% and turned fewer winners into losers (17% against 26%), at the cost of being stopped out on 76% of trades instead of 50%.
What percentage should a trailing stop loss be?
At least 3 times the stock’s median daily high-to-low range. On this list that median is 2.55%, so about 8% for a typical stock and 12% or more for names like AMD and CRWD that move over 4% a day. A 5% trail was stopped on 92% of all trades and on 99% of trades in the noisier half of the list.
Does a trailing stop loss protect against gaps?
No. When the stop price is reached the order becomes a market order and fills at the next available price. In the test, 11 of 408 trailing 8% stops filled more than 1% below the stop, and the worst trade for every exit was -26.1%, a gap. A trailing stop limit avoids the bad fill but may not fill at all.
Can I use a trailing stop loss on a funded account at OneStopProp?
Yes. OneStopProp executes on Match-Trader, which added a trailing stop loss in its October 2025 release, and overnight holds are allowed with no minimum holding time. Check the advanced order form on your account; if the trailing option is not there, move the stop up by hand after each new closing high. The position still has to be closed 5 minutes before and after FOMC, NFP, CPI, PPI and earnings on funded accounts without the News Trading Allowed Add-On.
How does a trailing stop loss interact with the daily loss limit?
The daily limit is measured at 12:00 AM EST from the higher of balance or equity, so open profit at midnight raises the next day’s floor. If you are up $2,000 on a $100K 2 Step account at midnight, equity cannot fall below $98,000 the next day. A trailing stop loss that has moved above the entry limits how much of that profit can be given back before the position closes. The max total loss is different: it does not trail. On a 2 Step account it stays at 8% below the initial balance, $92,000 on $100K, no matter how much profit you hold.
The Bottom Line
A trailing stop loss does 1 thing well: it lets a winning trade run while it caps what that trade can give back. On 538 real entries it did not add an edge, because no exit can, but it cut the gap losses that fixed stops take and turned fewer winners into losers. The price of that protection is the whipsaw, and the whipsaw is a function of 1 number: how wide the trail is compared with the stock’s ordinary daily range.
On a funded account the order earns its place at midnight. The daily loss limit is measured from your equity at 12:00 AM EST, which means profit you hold overnight is profit you can be charged for tomorrow. A trailing stop loss that has climbed above the entry is how that profit stays yours. The max total loss, by contrast, is set on day 1 and never moves.
If you want to run a trail like that on an account where the daily limit and the midnight snapshot are already written into the rules, start a funded account at OneStopProp: 1 Step, 2 Step or Instant, from $10K to $300K, with U.S. stock CFDs on the same list this test used, overnight holds allowed and no time limit on the challenge.
Sources
- Stop Order, U.S. Securities and Exchange Commission. The definition of a stop order and how it becomes a market order when the stop price is reached. https://www.sec.gov/answers/stopord.htm
- Understanding Order Types Can Save Time and Money, FINRA. The definition of a trailing stop limit order, trailing by points or by a percentage the investor specifies. https://syndication.finra.org/content/understanding-order-types-can-save-time-and-money
- Types of Orders, Investor.gov. Market, limit and stop orders, and the warning that a short-term fluctuation can activate a stop. https://www.investor.gov/introduction-investing/investing-basics/how-stock-markets-work/types-orders
- Match-Trade October Release: Trailing Stop Loss Feature, Match-Trader, October 21, 2025. The trailing stop loss added to the platform, on desktop and mobile, with drag-and-drop on the chart. https://match-trader.com/match-trade-october-release-trailing-stop-loss-feature/
- Historical Quotes, Nasdaq. Daily candles for the 155 stocks on OneStopProp’s instrument list, 2 years to November 3, 2026, used for the 538-trade test. https://www.nasdaq.com/market-activity/quotes/historical
- What is the Maximum Daily Loss?, OneStopProp Help Center. The 4% daily limit on 1 Step and 2 Step and 2% on Instant, measured at 12:00 AM EST from the higher of balance or equity, with the $102,000 example. https://help.onestopprop.com/faq/what-is-the-maximum-daily-loss/
- When is the daily max limit reset time?, OneStopProp Help Center. 12:00 AM EST. https://help.onestopprop.com/faq/when-is-the-daily-max-limit-reset-time/
- How does max total loss work?, OneStopProp Help Center. 6% on 1 Step, 8% on 2 Step and 5% on Instant, of the initial balance, measured on equity including floating positions, with the $92,000 example. Static, it does not trail. https://help.onestopprop.com/faq/how-does-max-total-loss-work-on-standard-accounts/
- How do I place orders on the trading platform?, OneStopProp Help Center. The supported order types: market, limit, stop loss and take profit. https://help.onestopprop.com/faq/how-do-i-place-orders/
- What trading platform do you use?, OneStopProp Help Center. Match-Trader for execution, TradingView for charting. https://help.onestopprop.com/faq/what-trading-platform-do-you-use/
- Can I hold trades overnight and over weekends? and Is there a minimum holding time?, OneStopProp Help Center. Overnight holds allowed, no minimum holding time. https://help.onestopprop.com/faq/can-i-hold-trades-overnight-and-over-weekends/
- What happens during halts or abnormal trading conditions?, OneStopProp Help Center. The recommendation to close positions during halts and abnormal conditions. https://help.onestopprop.com/faq/what-happens-during-halts-or-abnormal-trading-conditions/
- What Instruments Can I Trade?, OneStopProp Help Center. The U.S. stock CFD list the test covered. https://help.onestopprop.com/faq/what-instruments-can-i-trade/