The best time to day trade stocks is usually answered with a shrug: the open and the close, because that is when the volume is. Half of that is right, and the half that is wrong costs more than it sounds.
We measured it instead of repeating it. Every half hour of the regular session, across 98 of the US stocks listed in the OneStopProp Help Center, over 22 trading sessions to October 20, 2026. The result splits the open and the close apart, and it is the close that behaves nothing like its reputation.
Key Takeaways
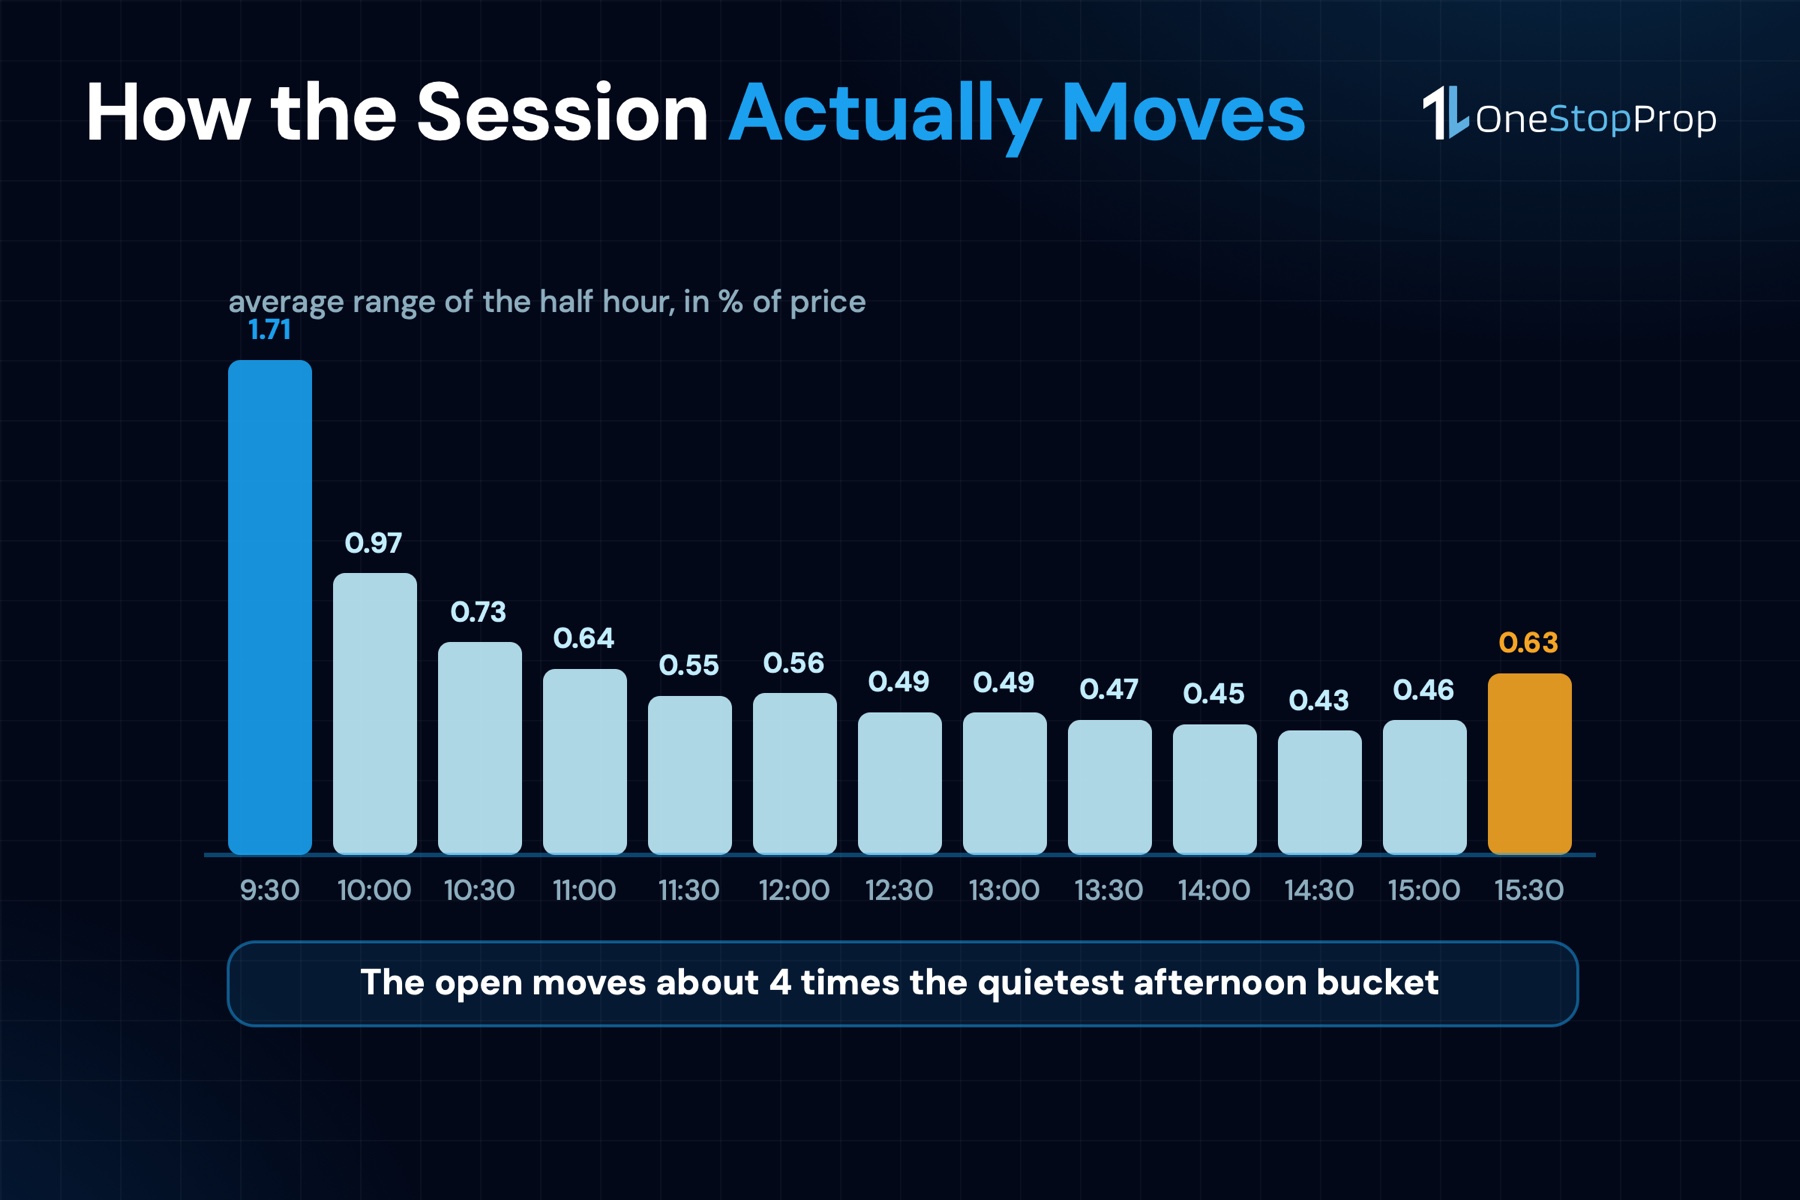
- The first 30 minutes move about 4 times as much as the quietest stretch. An average range of 1.71% from 9:30 to 10:00 ET against 0.43% from 14:30 to 15:00.
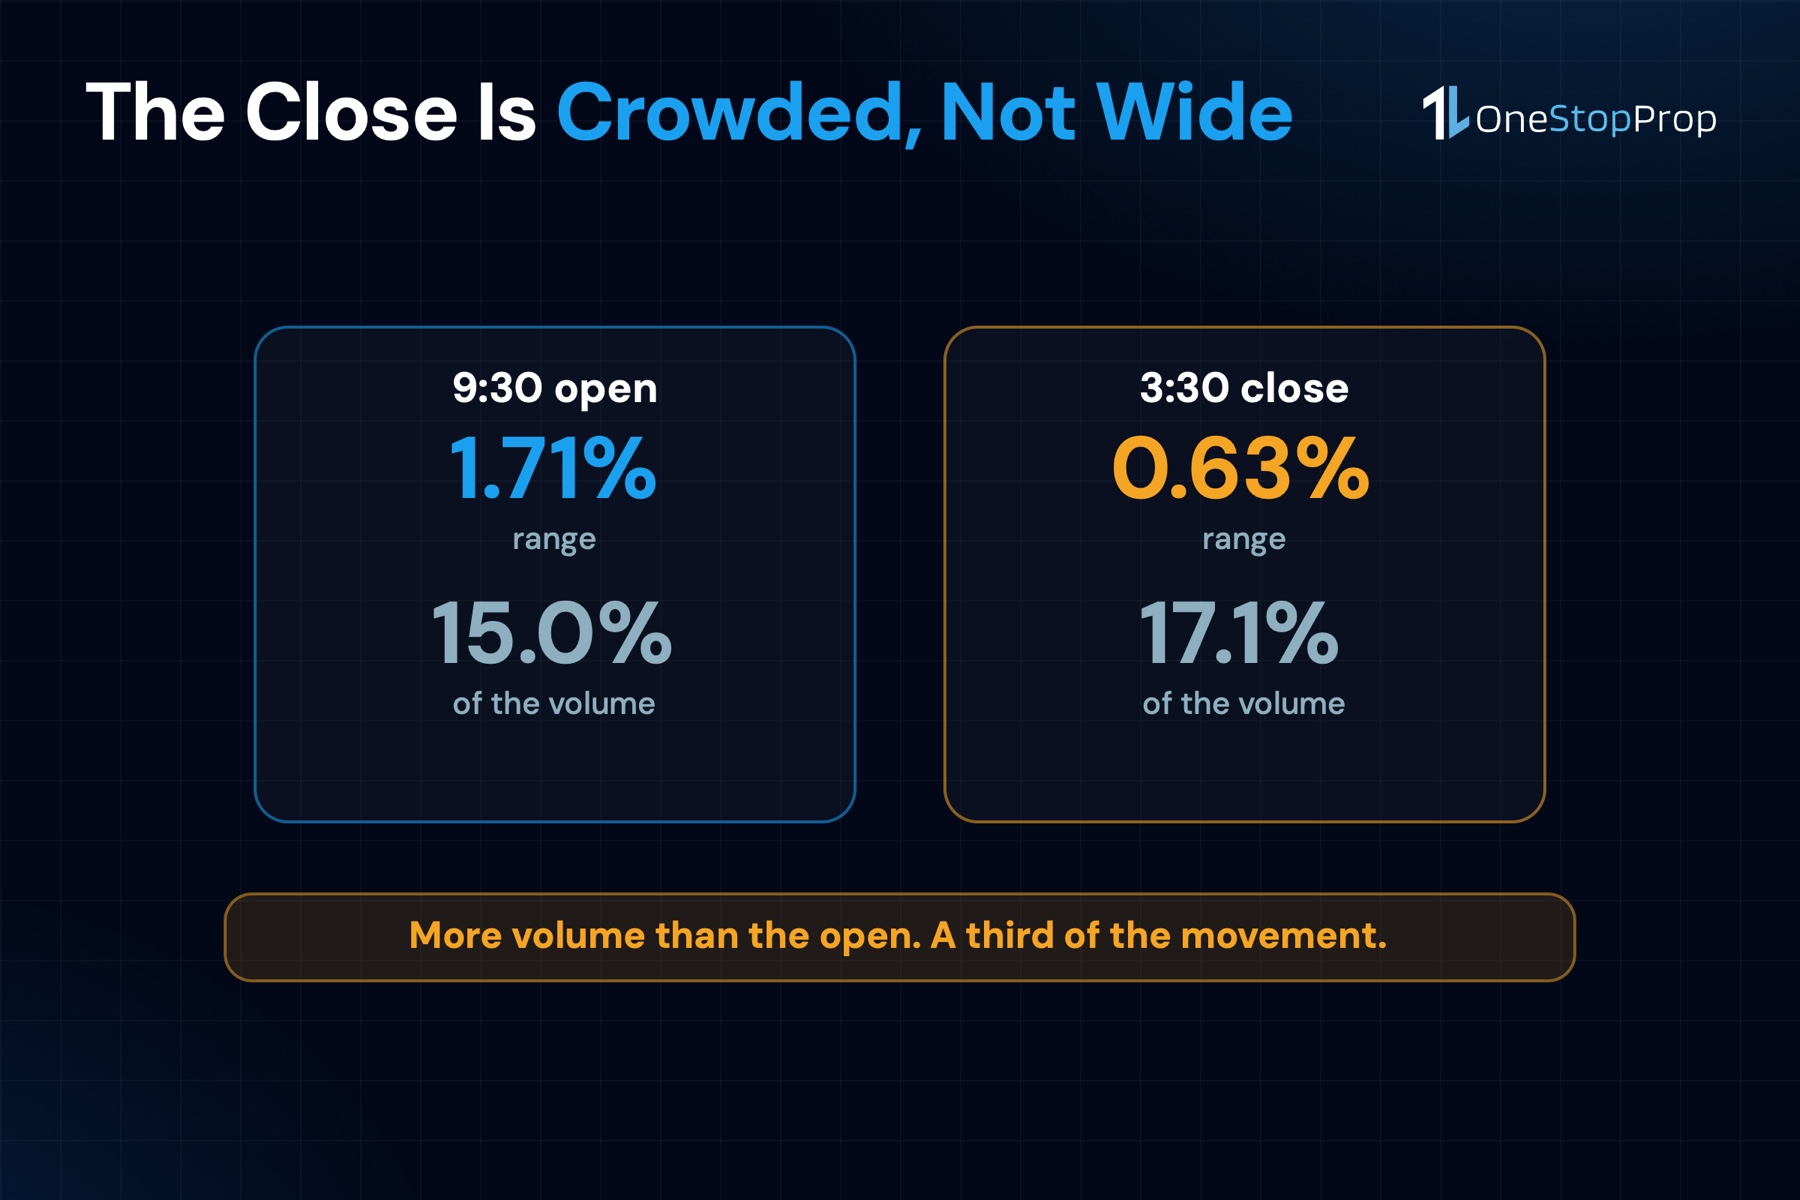
- The close carries more volume than the open and a third of the movement. The last half hour took 17.1% of the day’s volume against the open’s 15.0%, but its range was 0.63% against 1.71%.
- Volume is not opportunity. Those 2 numbers moving in opposite directions is the whole finding: a crowded tape does not mean a tape that travels.
- Midday is a plateau, not a cliff. From 11:30 to 15:00 every half hour sits between 0.43% and 0.56%, so there is no single dead hour to avoid.
- The same stop means different things at different hours. A stop sized for midday gets taken out by ordinary noise at 9:35, which is how a daily loss limit disappears before 10:00 AM.
What We Measured
The universe is the US stocks listed in the OneStopProp Help Center, not a screen of the whole market. That matters because a ranking you cannot act on is trivia.
For each stock we pulled 30 minute candles for the last month and kept the regular session, 9:30 AM to 4:00 PM ET. For every candle, range is the high minus the low divided by the close, expressed as a percentage. Each half hour bucket is the average of every candle that landed in it, a little over 2,000 candles per bucket.
Volume share is that bucket’s volume as a percentage of the total volume measured.
The Shape of the Day
| Half hour (ET) | Average range | Share of volume |
|---|---|---|
| 9:30 | 1.71% | 15.0% |
| 10:00 | 0.97% | 8.9% |
| 10:30 | 0.73% | 7.6% |
| 11:00 | 0.64% | 7.3% |
| 11:30 | 0.55% | 6.3% |
| 12:00 | 0.56% | 6.1% |
| 12:30 | 0.49% | 5.2% |
| 13:00 | 0.49% | 4.9% |
| 13:30 | 0.47% | 4.9% |
| 14:00 | 0.45% | 5.1% |
| 14:30 | 0.43% | 5.1% |
| 15:00 | 0.46% | 6.4% |
| 15:30 | 0.63% | 17.1% |
The Open Is Not Negotiable
The first half hour is in a category of its own. At 1.71% it carries nearly twice the range of the next bucket and about 4 times the quietest one.
That is not a reason to trade it. It is a reason to know that everything you believe about your stop distance was probably formed at a different hour of the day.
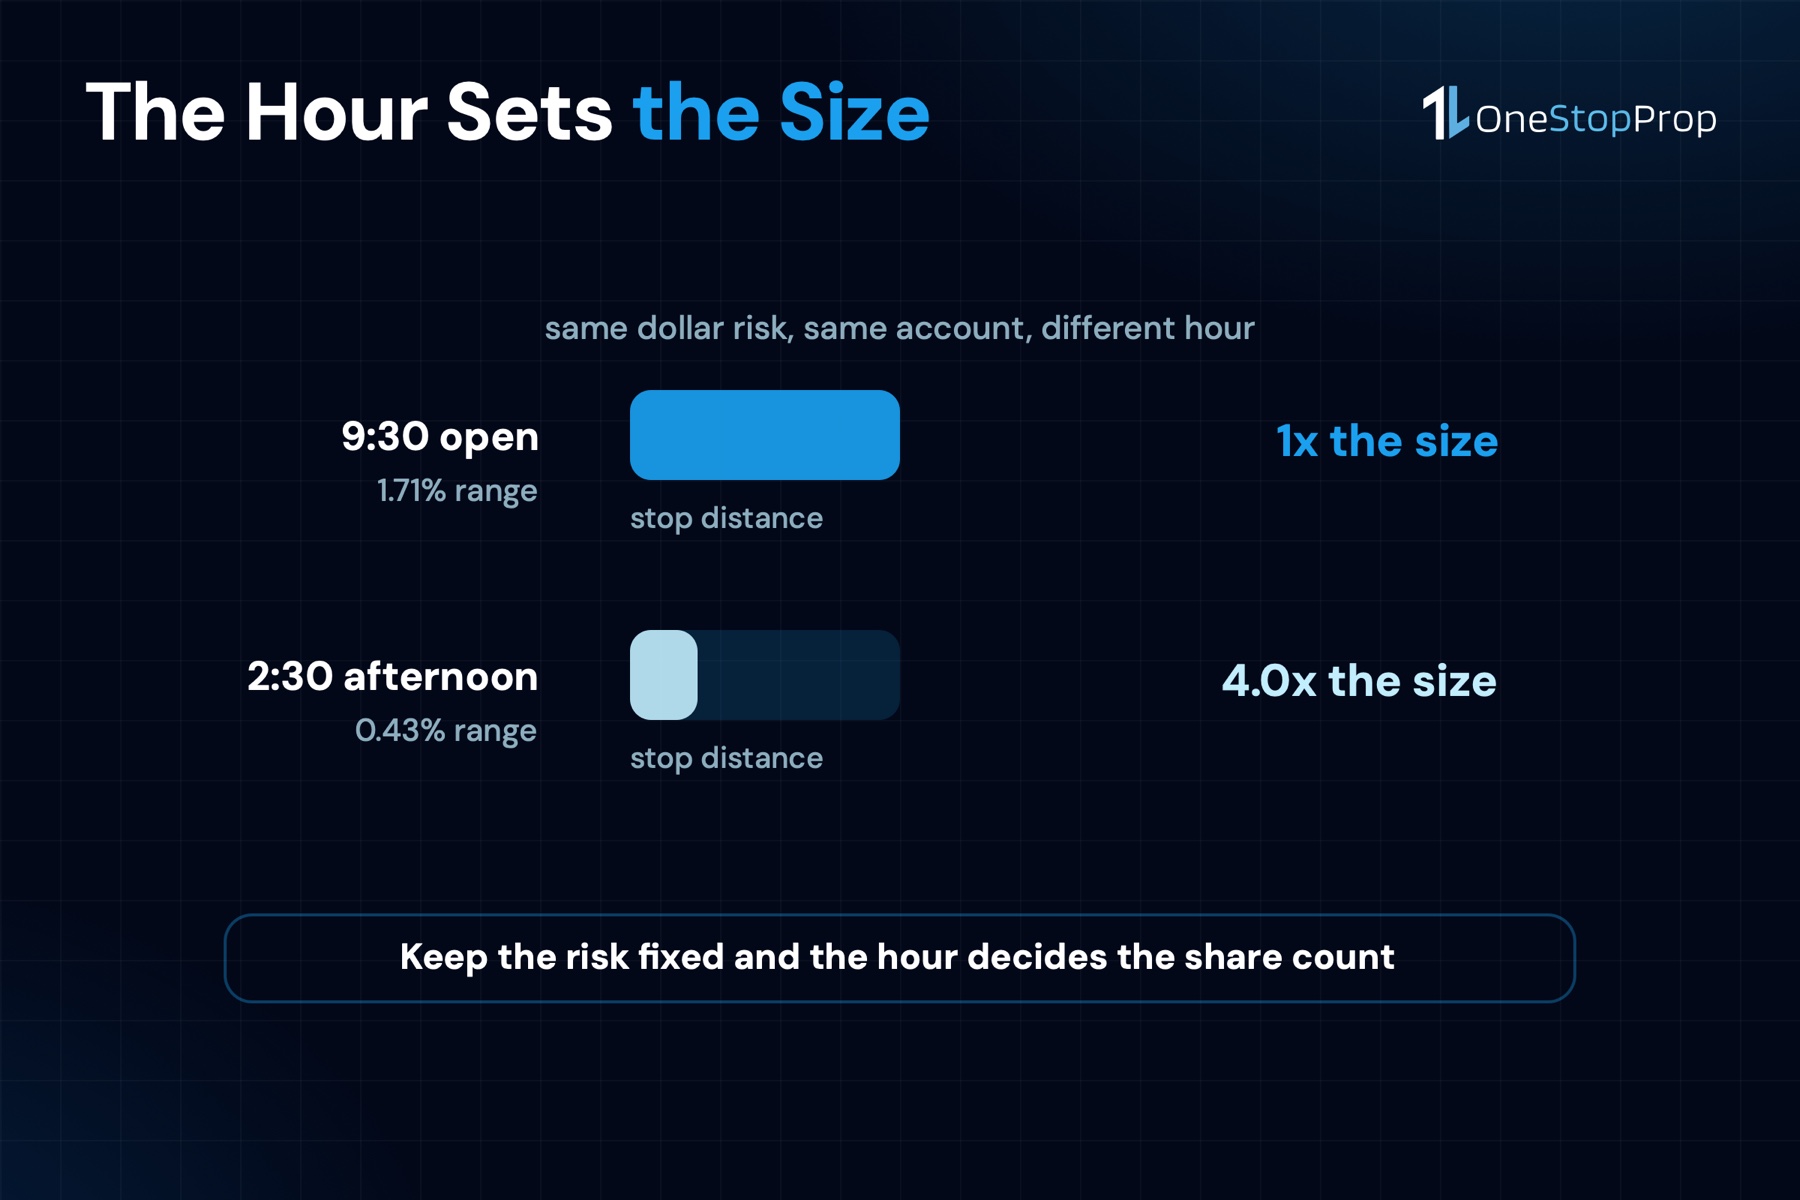
A 0.5% stop is a wide stop at 2:30 PM, where the whole half hour averages 0.43%. The same 0.5% stop at 9:35 is inside the noise, and getting stopped there is not a losing trade so much as a sizing error.
The Close Is the Surprise
Here is the part that does not match the folklore.
The last half hour of the session took 17.1% of the day’s volume, more than the opening half hour’s 15.0%. On volume alone, 3:30 to 4:00 PM is the busiest window of the day.
Its average range was 0.63%, barely over a third of the open’s 1.71%.
So the close is crowded and the close is quiet, at the same time. Enormous quantities of stock change hands inside a narrow band, which is what an auction into the closing print looks like: positioning, rebalancing and index flow, not price discovery.
Pro Tip: If you pick your window by looking at a volume histogram, you will pick the close. Volume tells you how much stock traded, not how far price travelled. For a day trade, the second number is the one that pays.
Midday Is Flatter Than It Looks
The received wisdom says to avoid the lunch hour. The data says the whole afternoon before the close is one long plateau.
From 11:30 onward every half hour sits between 0.43% and 0.56%. The difference between the supposedly dead 12:30 bucket and the supposedly fine 2:00 PM bucket is 0.04 percentage points, which is nothing.
The practical reading is that there is no cliff to step off at noon. There is a fast first hour, a slow rest of the day, and a crowded close.
What This Does to a Funded Account
The reason the hour matters on a funded account is that the daily loss limit does not care what time it is.
Risking a fixed percentage per trade, your share count is your dollar risk divided by your stop distance. If the stop distance has to grow 4 times to survive the open, the share count has to shrink by the same factor to keep the risk constant. Traders who keep the size and widen the stop are the ones who find out that 2 bad opening trades can reach the limit.
The arithmetic is the one from the risk reward ratio piece, applied to the clock instead of the chart.
Choosing Your Window
If you want range, the open pays for the risk. You get 1.71% of average movement, and you accept that stops have to be wider and size smaller.
If you want calm, the afternoon is consistent. 0.43% to 0.56% for 3 and a half hours, which is a narrower target but a far more predictable stop.
If you want the close, know what you are getting. Volume without range is a liquidity window, better for getting out of something than for starting something.
Pro Tip: Pick 1 window and measure your own results inside it for a month before adding a second. Most traders are not losing to the wrong hour, they are losing to trading 3 different hours with 1 set of assumptions.
Common Mistakes With Session Timing
Using one stop distance all day
The same percentage stop is wide at 2:00 PM and tight at 9:35. If the stop does not move with the hour, the size has to.
Reading volume as volatility
The close has the most volume and nearly the least range. They are different measurements and only one of them is what a day trade needs.
Trading the open with afternoon size
This is the expensive version of the first mistake, and it is the one that reaches a daily loss limit fastest.
Assuming every stock follows the average
These are averages across 98 names. A stock with a catalyst that morning has its own shape, and the stock’s own daily range is the better starting point for sizing it.
Frequently Asked Questions
What is the best time to day trade stocks?
By movement, the first 30 minutes after the 9:30 AM ET open: 1.71% average range against 0.43% in the quietest afternoon bucket, measured across 98 US stocks over 22 sessions. By liquidity, the last 30 minutes, which took 17.1% of the day’s volume.
Is the last hour good for day trading?
It is the most liquid and one of the least volatile. The 3:30 to 4:00 PM bucket had the largest share of volume and a range about a third of the open’s, which makes it better for exiting than for entering.
Should I avoid trading at lunch?
The data does not support treating it as special. From 11:30 AM to 3:00 PM every half hour averaged between 0.43% and 0.56%, so midday is part of one long plateau rather than a hole.
Why does the open move so much?
Overnight news, pre-market imbalances and the opening auction all resolve in the first prints of the session. That concentration is what produces 1.71% of average range in 30 minutes.
Does the best time to day trade change by stock?
Yes. These are averages across 98 names, and a stock with earnings or a catalyst that day has its own profile. The average tells you the shape of a normal session, not of every session.
How does the hour affect my position size?
Through the stop. Size is dollar risk divided by stop distance, so a stop that has to be 4 times wider at the open means a position 4 times smaller to carry the same risk.
The Bottom Line
The best time to day trade stocks depends on which number you are asking about, and most people ask about the wrong one.
Volume peaks at the close. Movement peaks at the open, by a factor of about 4 over the quiet part of the afternoon. Those 2 peaks are at opposite ends of the day, and a trader who picks a window by volume ends up in the hour with the least to work with.
Pick the hour for the range, then size the position for the range of that hour. The daily loss limit is the same at 9:35 as it is at 2:30, which means the only thing that can absorb the difference is your share count.
Sources
- What instruments can I trade?, OneStopProp Help Center. The list of US stocks that defines the universe measured here. https://help.onestopprop.com/faq/what-instruments-can-i-trade/
- Funded Account Trading: How It Works, OneStopProp. Daily and total loss limits by route. https://onestopprop.com/funded-account-trading/
- Risk Reward Ratio for Stock Traders, OneStopProp. How stop distance decides position size. https://onestopprop.com/risk-reward-ratio-stock-traders/
- Most Volatile Stocks to Day Trade, OneStopProp. Average daily range by stock. https://onestopprop.com/most-volatile-stocks-day-trade/
- Trading Information, NYSE. The regular session hours the measurement covers. https://www.nyse.com/markets/nyse/trading-info
- Day Trading, Investor.gov, U.S. Securities and Exchange Commission. What day trading is and the risk that comes with it. https://www.investor.gov/introduction-investing/investing-basics/glossary/day-trading