The head and shoulders pattern is 3 peaks with the middle one highest, a line under the 2 dips between them, and a close below that line. Every chart book has the drawing. Almost none of them have the count: how often the break actually falls to the target, how often it comes back through the neckline, and how far away the stop sits.
So this guide counted. It scanned 2 years of daily candles on the 155 U.S. stocks on OneStopProp’s instrument list with a fixed definition, found 112 head and shoulders tops and 138 inverse patterns that confirmed in the last 12 months, and followed every one for 20 sessions.
Then it does the part that matters on a funded account: the stop is far, the target is rarer than the books say, and the position size has to come from the first number, not the second.
Key Takeaways
- A head and shoulders pattern needs 4 things: an uptrend into it, 3 peaks with the head highest, a neckline through the 2 troughs, and a close below the neckline. Without the close there is no pattern, only a drawing.
- The measured move is the exception. Of 112 tops on OneStopProp’s list, 3% reached the full head-height target within 20 sessions. 29% gained 1R, 36% traded back above the right shoulder, and 79% returned to the neckline first.
- The inverse pattern did better this year. Of 138 inverse head and shoulders bottoms, 11% hit the target, 41% gained 1R and 36% were stopped. The median best move in 20 sessions was 7.5%.
- The stop is the problem, not the target. With the stop above the right shoulder, the median risk was 10.5% of the entry price on tops. On a $100K 1 Step or 2 Step account that turns $500 of risk into a position under $5,000.
- Bulkowski’s long-horizon numbers are better than these, and still humbling: 51% of tops meet the target, 19% fail outright, 68% pull back. The 20-session window and a mechanical scan explain the gap.
What a Head and Shoulders Pattern Is
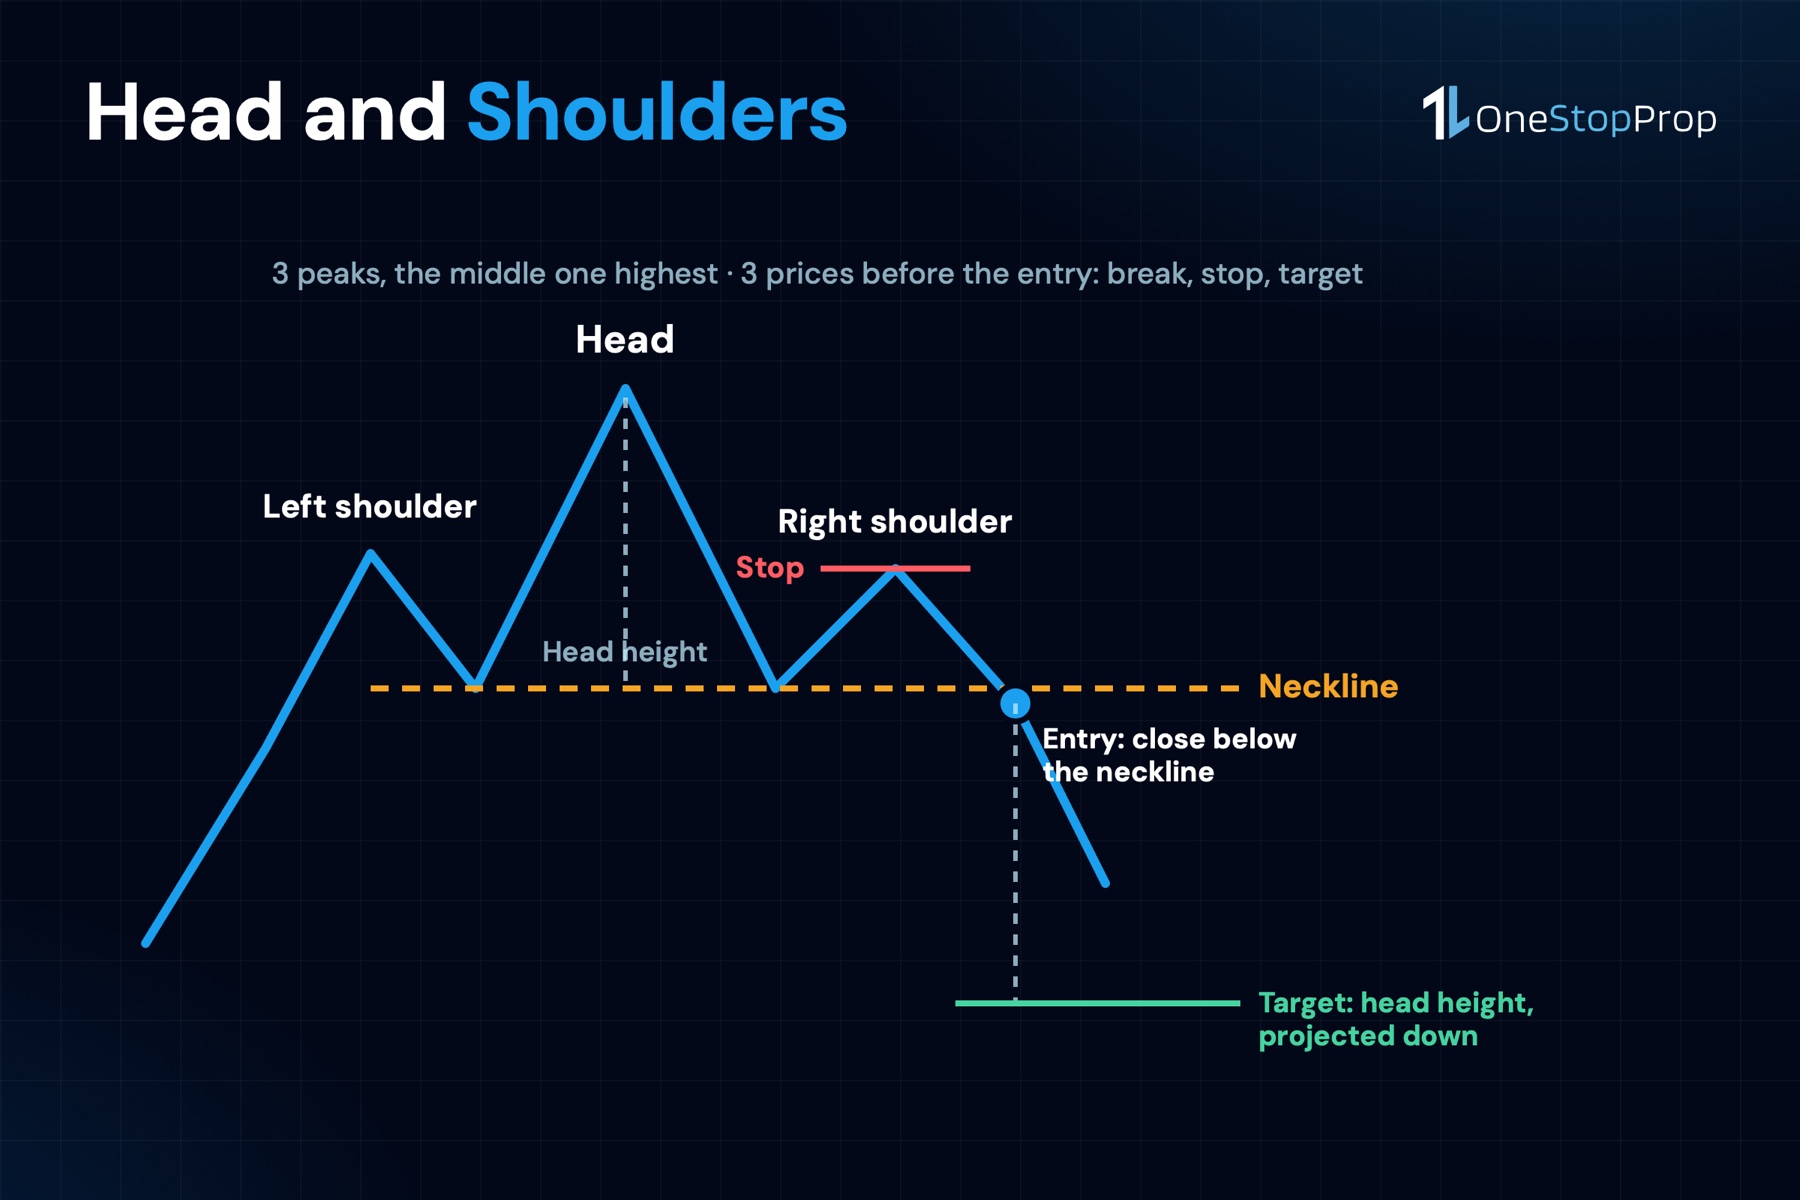
A head and shoulders pattern is a reversal pattern at the end of an uptrend. The stock makes a high (the left shoulder), dips, makes a higher high (the head), dips again to about the same level, and makes a lower high (the right shoulder). A line drawn through the 2 dips is the neckline. When the stock closes below it, the pattern is confirmed and the expected move is down.
Thomas Bulkowski’s catalog of head and shoulders tops, the standard statistical reference on chart patterns, puts the identification guidelines in 6 lines. Price trend upward into the pattern. 3 peaks with the middle one above the others, proportional and not lopsided. Shoulders that peak near the same price and sit about the same distance from the head. Volume highest on the left shoulder, then the head, trending down through the pattern 61% of the time. A neckline joining the 2 armpits. And confirmation only when price closes below the neckline.
The inverse head and shoulders pattern is the same shape upside down, at the end of a downtrend: 3 valleys with the middle one lowest, a neckline over the 2 bounces, and a close above it. Bulkowski’s page on bottoms notes volume is highest on the left shoulder or head and diminished on the right shoulder.
What makes the pattern tradable is that it hands you 3 prices before the entry: the neckline break (entry), the right shoulder’s high (stop) and the head’s height projected down from the break (target). The question is what those 3 prices are worth, and that is what the scan measured.
How the Scan Defined It
A pattern that cannot be counted cannot be argued with, so here is the definition as 6 checks, run on the daily candles of the 155 stocks on OneStopProp’s instrument list from Nasdaq’s historical data. 143 stocks had 2 full years. Patterns had to confirm between November 3, 2025 and November 3, 2026.
- Pivots. A peak is a session whose high is the highest of the 5 sessions on each side. A trough is the lowest low of 5 on each side.
- Sequence. Peak, trough, peak, trough, peak, with the middle peak at least 3% above both shoulders.
- Prior trend. The head is the highest high of the 60 sessions before it.
- Symmetry. The 2 shoulders, measured as height above the neckline, are within 25% of each other. The whole pattern is 15 to 120 sessions wide.
- Neckline. The line through the 2 troughs, extended to the right.
- Confirmation. The first close below the neckline after the right shoulder, within 40 sessions of it. That close is the entry.
For the inverse head and shoulders pattern the 6 checks were flipped. Every pattern was followed for 20 sessions after the confirming close, with the stop at the right shoulder’s extreme and the target at the head’s height beyond the neckline.
What 112 Head and Shoulders Tops Did
| Within 20 sessions of the break | Tops (112) | Inverse bottoms (138) |
|---|---|---|
| Reached the measured move | 3% | 11% |
| Gained at least 1R | 29% | 41% |
| Traded through the stop (right shoulder) | 36% | 36% |
| Returned to the neckline within 10 sessions | 79% | 75% |
| Stop came before 1R | 38 patterns | 47 patterns |
| 1R came before the stop | 30 patterns | 49 patterns |
| Neither in 20 sessions | 44 patterns | 42 patterns |
| Median head height above the neckline | 23.3% | 15.2% |
| Median distance to the stop | 10.5% | 8.7% |
| Median pattern width | 68 sessions | 56 sessions |
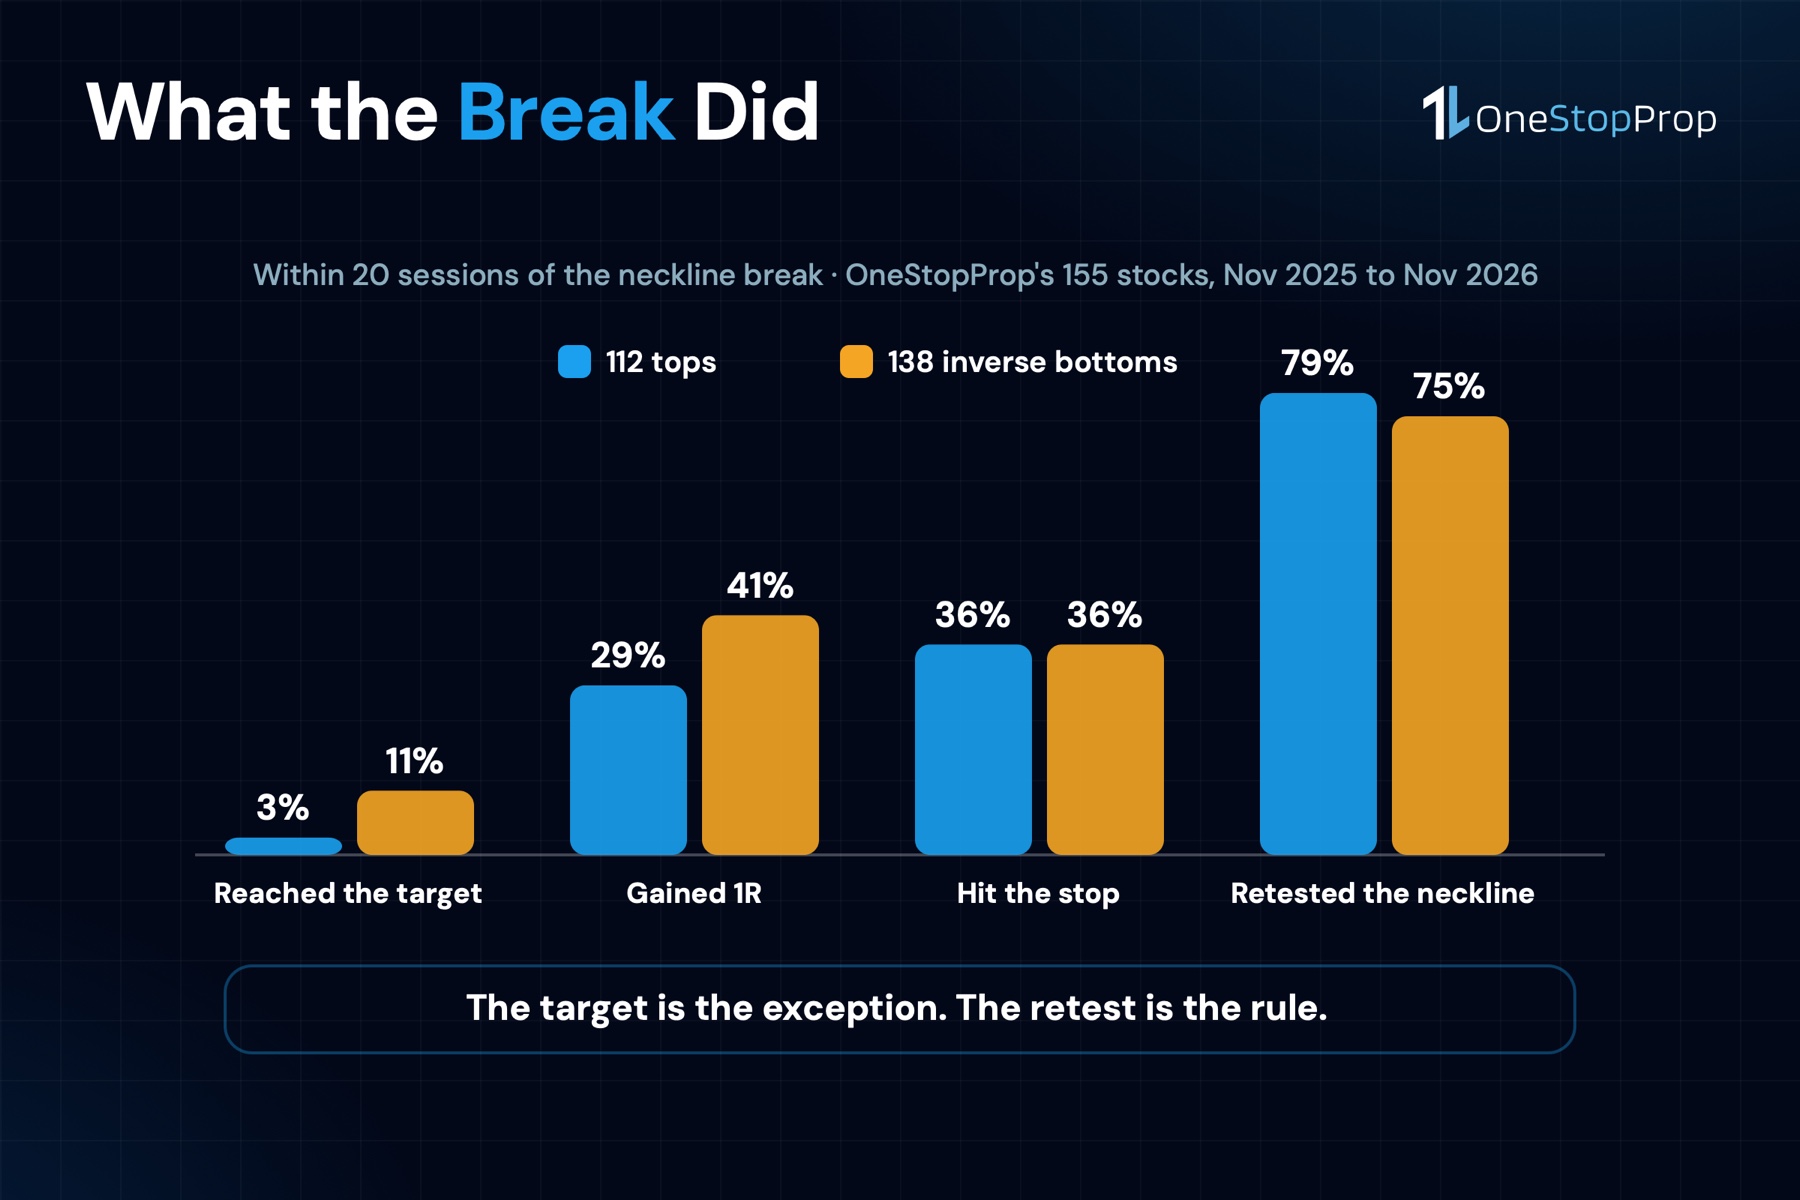
4 things to read out of that table.
The target almost never came inside 20 sessions. 3 of 112 tops reached the full measured move. Bulkowski’s 51% is over an unlimited horizon on hand-selected patterns; a mechanical scan with a 20-session clock gets 3%. Both numbers are true. The one that applies to a position with a daily loss limit on it is the second.
The stop is far, and it still gets hit. The right shoulder sat a median 10.5% above the entry on tops. That is a wide stop, and 36% of patterns traded through it anyway. On the 18 tops where the stop was within 6%, the stop was hit 56% of the time and 1R was reached 44%: tighter was not safer, it was just faster.
The pullback is the rule. 79% of tops returned to the neckline within 10 sessions of breaking it. Bulkowski’s figure is 68%. A trader who enters the close of the break and has no tolerance for a retest will be stopped, or will panic, before most of these patterns go anywhere.
The inverse version did better in this sample. 11% hit the target, 41% gained 1R, and 49 patterns reached 1R before the stop against 47 that hit the stop first. 2026 had a sharp correction in February and March followed by a strong recovery, and most inverse patterns confirmed in April, May and June. That is the market helping the pattern, not the pattern beating the market, and it should be read that way.
Pro Tip: before trading any pattern on a funded account, write down the 3 prices it gives you and divide the stop distance into your risk per trade. If the share count is too small to matter, the pattern is too wide for your account, whatever the chart looks like. The bull flag pattern scan on the same list found the same thing: the stop decides the trade.
A Real Head and Shoulders Top: Apple, November 2025 to January 2026
The cleanest top in the sample, with every price from the daily data.
- Left shoulder: November 13, 2025, high $276.70.
- First trough: November 18, low $265.32.
- Head: December 3, high $288.62, the highest point of the previous 60 sessions.
- Second trough: December 18, low $266.95.
- Right shoulder: January 2, 2026, high $277.84. Within $1 of the left shoulder.
- Neckline break: January 5, close $267.26.
The head stood $21.58 above the neckline, so the measured move was $267.26 minus $21.58, which is $245.68, and the scan’s target on the sloping neckline was $244.74. The stop was the right shoulder’s high, $277.84, which is 4.0% above the entry, a tight pattern by this sample’s standards.
AAPL fell to $243.42 on January 20, 11 sessions after the break, through the target. Then it recovered the whole move: 20 sessions after the break it closed at $269.48, above the entry. The stop was never touched.
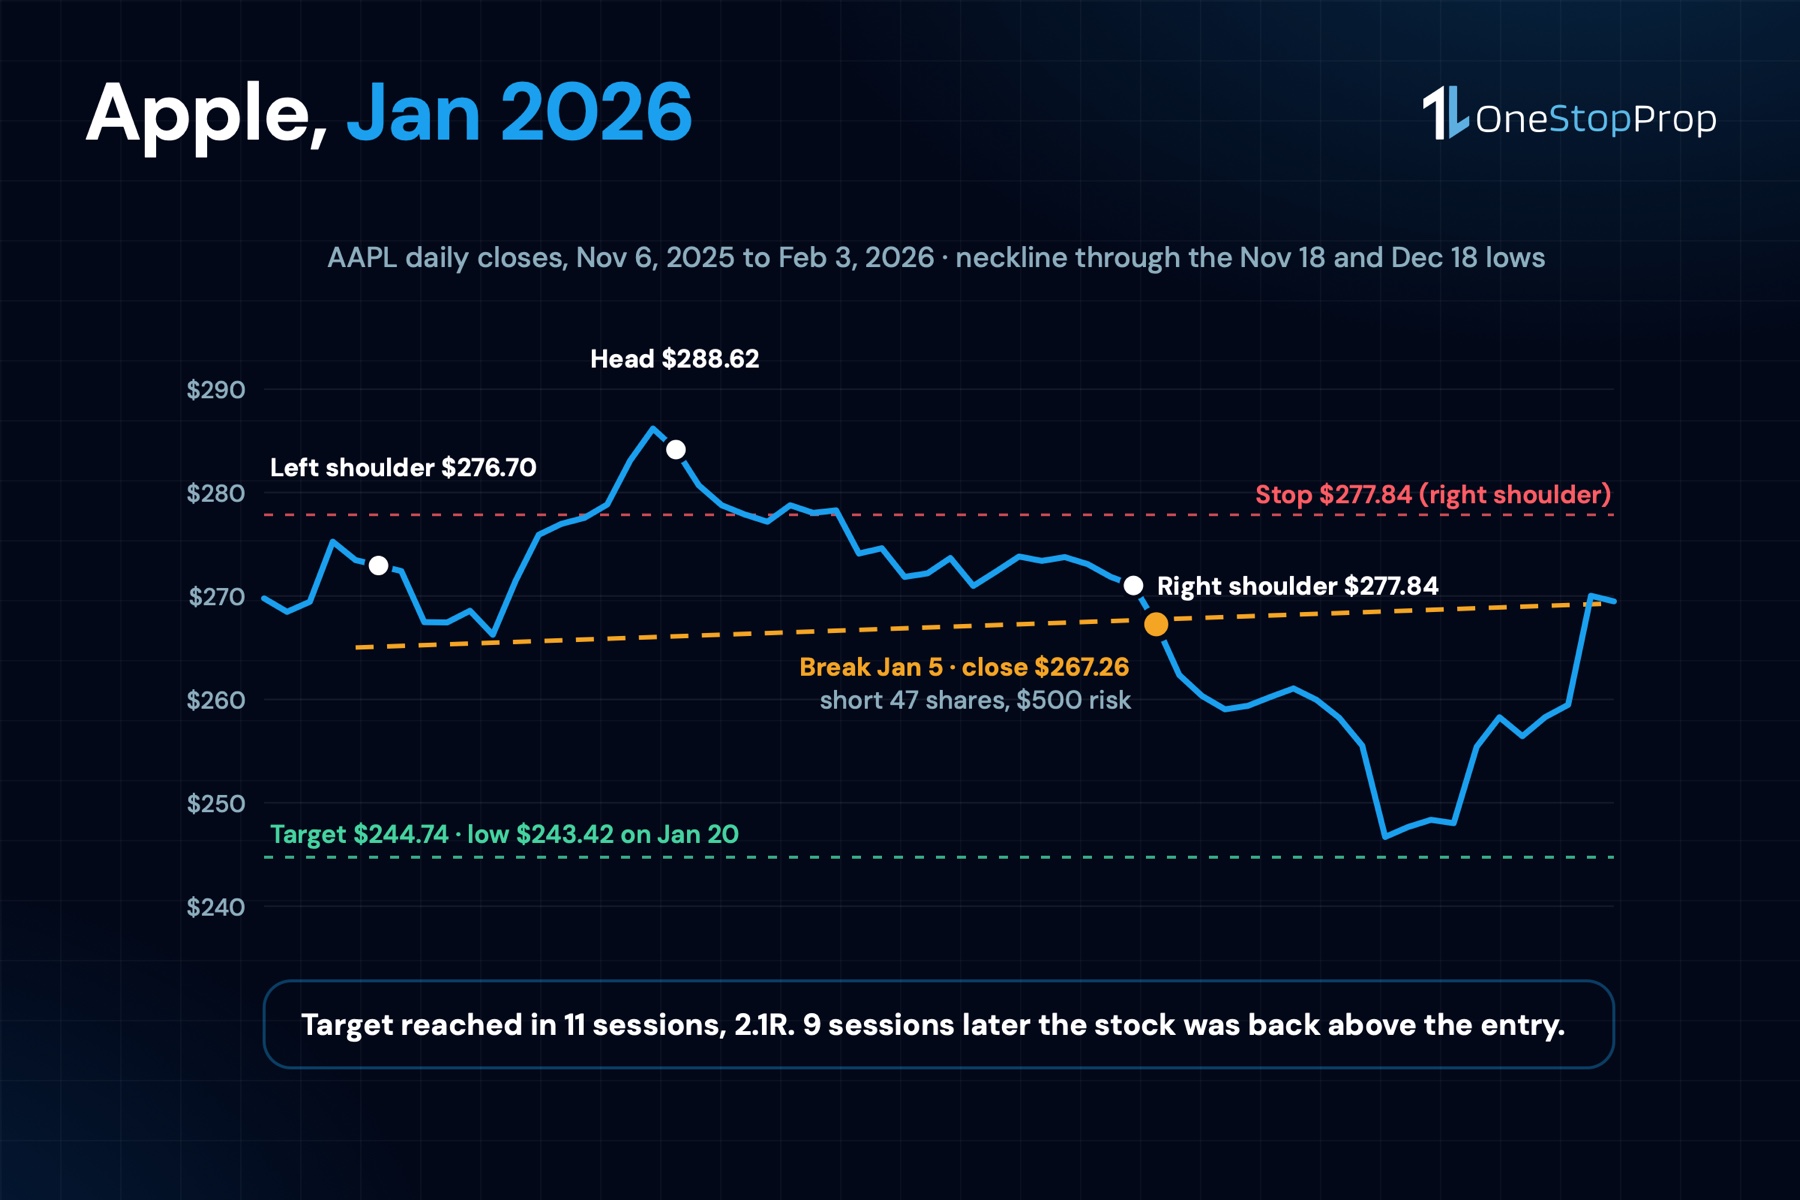
Here is the trade on a $100K 2 Step account with 0.5% risk, which is $500, as a short, which the how to short a stock guide covers for a funded account.
- Entry $267.26, stop $277.84. Distance $10.58.
- Shares: $500 divided by $10.58, which is 47 shares, about $12,561 of stock as a CFD.
- 1R target: $256.68. Reached on the way down.
- Measured move: $244.74. Reached on January 20. 47 shares times $22.52 is $1,058, 2.1 times the risk.
- A trader who was still holding on February 3, waiting for more: $0, plus 20 sessions of a short position inside a daily loss limit.
The pattern worked exactly as drawn and still paid nothing to the trader who did not take the target.
2 Tops That Did Not Work
Amazon, February 2026. Left shoulder $238.85 on September 9, 2025, head $258.60 on November 3, right shoulder $248.94 on January 12, 2026, break on February 5 at a close of $222.69. The head was 21.5% above the neckline, so the target was $176.95, and the stop was 11.8% away at $248.94. AMZN fell to $196.00 on February 17, which is 1R, and no further. 20 sessions after the break it closed at $213.21. The pattern was right about the direction and wrong about the distance by a factor of 2.
Alphabet, September 2026. Head $404.47 on May 18, right shoulder $381.81 on August 5, break on September 9 at $328.38. A head 39.4% above the neckline put the target at $214.10 and the stop 16.3% away. GOOG did nothing of the sort: it closed 20 sessions later at $347.37, 5.8% above the entry, without touching the stop. A pattern that large needs a stop so wide that $500 of risk buys 9 shares, and then it goes sideways.
The Inverse Head and Shoulders Pattern: AMD, April 2026
The best inverse head and shoulders pattern in the sample, and a reminder of what the pattern can do when the market turns with it.
- Left shoulder: February 5, 2026, low $190.72.
- Head: March 3, low $188.22.
- Right shoulder: March 30, low $192.87. 3 lows inside $5 of each other over 8 weeks.
- Neckline break: April 8, close $231.82, above the line through the February 11 and March 25 bounces.
The target was $264.00 and the stop $192.87, 16.8% below the entry. AMD reached the target, then kept going: the high of the next 20 sessions was $430.60 on May 6. CrowdStrike confirmed an inverse pattern 9 days later, on April 17 at $105.99, and reached $149.56 within 20 sessions, 41% above the entry.
2 things about those numbers. First, they are the top of the distribution, not the middle: the median best move across all 138 inverse patterns was 7.5%. Second, the stop was 16.8% away on AMD, which at $500 of risk is 12 shares, about $2,800 of stock. The 85% move paid 5 times the risk, on a position that size. The pattern did not make the trader rich. It made a small position pay well.
How to Trade a Head and Shoulders Pattern on a Funded Account
The pattern gives 3 prices. The account gives the rules that decide what to do with them.
1. Wait for the close below the neckline. Bulkowski’s confirmation rule and the scan’s are the same: a close, not a wick. Entering before the close is entering a pattern that does not exist yet, and 79% of these came back to the neckline anyway.
2. Put the stop above the right shoulder, and size from it. Risk per trade divided by the stop distance. On a $100K 1 Step or 2 Step account the daily loss limit is 4% of the initial balance, $4,000, measured at 12:00 AM EST from the higher of balance or equity, per the Help Center’s maximum daily loss page. On Instant it is 2%. A stop 10.5% away at 0.5% risk is a position of about $4,760; at 1% risk, $9,500. Pick the risk, and the pattern tells you the size. The trading plan template has the page for it.
3. Take 1R, or at least part of the position at 1R. 29% of tops reached 1R and 3% reached the target. The AAPL trade reached both and gave both back. A plan that takes nothing before the measured move is a plan that gets paid on 3 patterns in 100.
4. Expect the retest. 3 patterns in 4 came back to the neckline within 10 sessions. The stop above the right shoulder is above that retest by definition. If the retest is intolerable, the position is too big, not the stop too wide.
5. Mind the news window and the halt. On funded accounts, every trade has to be closed 5 minutes before and after FOMC, NFP, CPI, PPI and earnings, unless the account carries the News Trading Allowed Add-On. A short held through a halt fills at the reopen, as the trading halts guide shows. A head and shoulders pattern completing the week of a company’s earnings is a pattern with a hole in it.
6. Put a clock on it. 44 of 112 tops reached neither the stop nor 1R in 20 sessions. A short that goes nowhere for 4 weeks is a daily loss limit’s worth of exposure earning nothing. The trailing stop loss guide has the exit that handles a trade like that.
The Arithmetic of the Wide Stop
The number from this scan that should change how a funded trader uses the pattern is 10.5%, the median distance from the neckline break to the right shoulder’s high. Here is what it does to 3 account sizes at 0.5% risk per trade, on a $200 stock.
| Account | Risk at 0.5% | Stop 10.5% away | Shares | Position |
|---|---|---|---|---|
| $50K 2 Step | $250 | $21.00 | 11 | $2,200 |
| $100K 2 Step | $500 | $21.00 | 23 | $4,600 |
| $200K 2 Step | $1,000 | $21.00 | 47 | $9,400 |
Compare that with the bull flag pattern, where the stop below the flag sat a few percent away and the same $500 bought 47 shares of a $120 stock. The head and shoulders pattern is a reversal pattern with a wide invalidation, and the only honest way to trade it on a funded account is small. The risk reward ratio guide has the win rates each target multiple needs; at a 29% 1R rate, the pattern needs the occasional AAPL to pay for the AMZNs.
Common Mistakes With the Head and Shoulders Pattern
Trading the drawing before the close
A right shoulder that is still forming is a stock in an uptrend making a lower high. That happens constantly. The pattern exists when the neckline closes, and not before.
Sizing for the target
The target on tops was a median 23.3% below the neckline, and 3% of patterns got there in 20 sessions. A position sized so that the target “makes the month” is a position sized for an outcome that almost never arrives.
Putting the stop just above the neckline
It is tighter, and the retest hits it 79% of the time. The right shoulder is the invalidation because a close above it means the lower high is gone and the pattern with it.
Ignoring what the market is doing
138 inverse patterns outperformed 112 tops this year because the index corrected in the spring and recovered. A head and shoulders pattern against the index’s direction is fighting the thing that decides most of its outcome.
Holding through the measured move in both directions
AAPL reached its target on January 20 and was back above the entry 2 weeks later. The pattern projects a distance, not a schedule, and not a floor.
Frequently Asked Questions
What is a head and shoulders pattern?
A reversal pattern at the end of an uptrend: a peak (left shoulder), a higher peak (head), a lower peak (right shoulder), a neckline drawn through the 2 troughs between them, and a close below the neckline that confirms it. The expected move is down by the head’s height above the neckline.
How reliable is the head and shoulders pattern?
On 112 tops across OneStopProp’s 155 stocks in the last 12 months, 29% gained 1R within 20 sessions, 3% reached the measured move and 36% traded back above the right shoulder. Bulkowski’s longer-horizon sample of more than 2,800 patterns reports 51% meeting the target and a 19% break-even failure rate.
What is the inverse head and shoulders pattern?
The same shape upside down at the end of a downtrend: 3 valleys with the middle one lowest, a neckline over the 2 bounces, and a close above it. On 138 of them in this scan, 41% gained 1R and 11% reached the target within 20 sessions; Bulkowski reports 71% meeting the target over an unlimited horizon.
Where does the stop go on a head and shoulders pattern?
Above the right shoulder’s high on a top, below the right shoulder’s low on an inverse pattern. In this sample that was a median 10.5% from the entry on tops and 8.7% on bottoms, which is why position size on a funded account has to be small.
How do you calculate the head and shoulders target?
Measure the vertical distance from the head to the neckline directly below it, and subtract that distance from the neckline at the break. On Apple’s January 2026 top the head was $21.58 above the neckline and the break was at $267.26, for a target near $245. The stock reached $243.42.
Can I short a head and shoulders pattern on a funded account?
Yes. Shorting is allowed on all instruments at OneStopProp, overnight holds are allowed, and there is no minimum holding time. The daily loss limit still applies, 4% on 1 Step and 2 Step and 2% on Instant, and the position has to be closed around the 5-minute news window on funded accounts without the News Trading Allowed Add-On.
The Bottom Line
The head and shoulders pattern is real, and on a stock list with daily data it is a modest edge with a wide stop. 29% of tops paid 1R, 3% paid the full target, 79% retested the neckline, and the stop sat a median 10.5% away. The inverse pattern did better in a year that favoured it.
Traded the way the books suggest, sized for the measured move and held until it comes, the pattern pays 3 times in 100. Traded the way the numbers suggest, small, with the stop above the right shoulder and at least part of the position off at 1R, it is a reversal setup that fits inside a daily loss limit.
If you want to run that version on an account where the daily and total loss limits are written down before the first pattern forms, start a funded account at OneStopProp: 1 Step, 2 Step or Instant, from $10K to $300K, with U.S. stock CFDs on the same list this scan used, shorting allowed on every instrument and no time limit on the challenge.
Sources
- Head-and-Shoulders Tops, Bulkowski’s ThePatternSite.com. Identification guidelines, the measure rule, and the bull market results: 51% meeting the target, 19% break-even failure, 68% pullback rate, average decline 16%, on more than 2,800 patterns. https://thepatternsite.com/hst.html
- Head-and-Shoulders Bottom, Bulkowski’s ThePatternSite.com. The inverse pattern: 71% meeting the target, 11% failure, 65% throwback rate, average rise 45%, on 3,197 patterns. https://thepatternsite.com/hsb.html
- Historical Quotes, Nasdaq. Daily candles for the 155 stocks on OneStopProp’s instrument list, 2 years to November 3, 2026, used for the scan and the AAPL, AMZN, GOOG, AMD and CRWD examples. https://www.nasdaq.com/market-activity/quotes/historical
- Stop Order, U.S. Securities and Exchange Commission. A stop order becomes a market order when the stop price is reached; a buy stop above the market protects a short position. https://www.sec.gov/answers/stopord.htm
- What Instruments Can I Trade?, OneStopProp Help Center. The U.S. stock CFD list the scan covered. https://help.onestopprop.com/faq/what-instruments-can-i-trade/
- Is shorting allowed?, OneStopProp Help Center. Shorting allowed on all instruments. https://help.onestopprop.com/faq/is-shorting-allowed/
- What is the Maximum Daily Loss?, OneStopProp Help Center. 4% of the initial balance on 1 Step and 2 Step, 2% on Instant, measured at 12:00 AM EST. https://help.onestopprop.com/faq/what-is-the-maximum-daily-loss/
- Is news trading allowed?, OneStopProp Help Center. The 5-minute window around FOMC, NFP, CPI, PPI and earnings on funded accounts, and the News Trading Allowed Add-On. https://help.onestopprop.com/faq/is-news-trading-allowed/
- Is there a minimum holding time?, OneStopProp Help Center. None. https://help.onestopprop.com/faq/is-there-a-minimum-holding-time/