Support and resistance trading rests on 1 claim: a price where a stock turned before is a price where it is more likely to turn again. Every chart has those lines drawn on it. Almost no guide says how often the line holds, how often it breaks, what a break is worth, and how often the broken line turns into the opposite kind of level.
So this guide counted. It marked every 10-session pivot high and low on the 155 U.S. stocks on OneStopProp’s instrument list over 2 years of daily data, waited for the price to come back to each one, and logged what happened over the next 10 sessions. 1,415 levels, 2,048 tests, all in the last 12 months.
Then it does the part that matters on a funded account: where the stop goes so a wick does not take it, why the break is the worse trade, and how a 7% bounce fits inside a 4% daily loss limit.
Key Takeaways
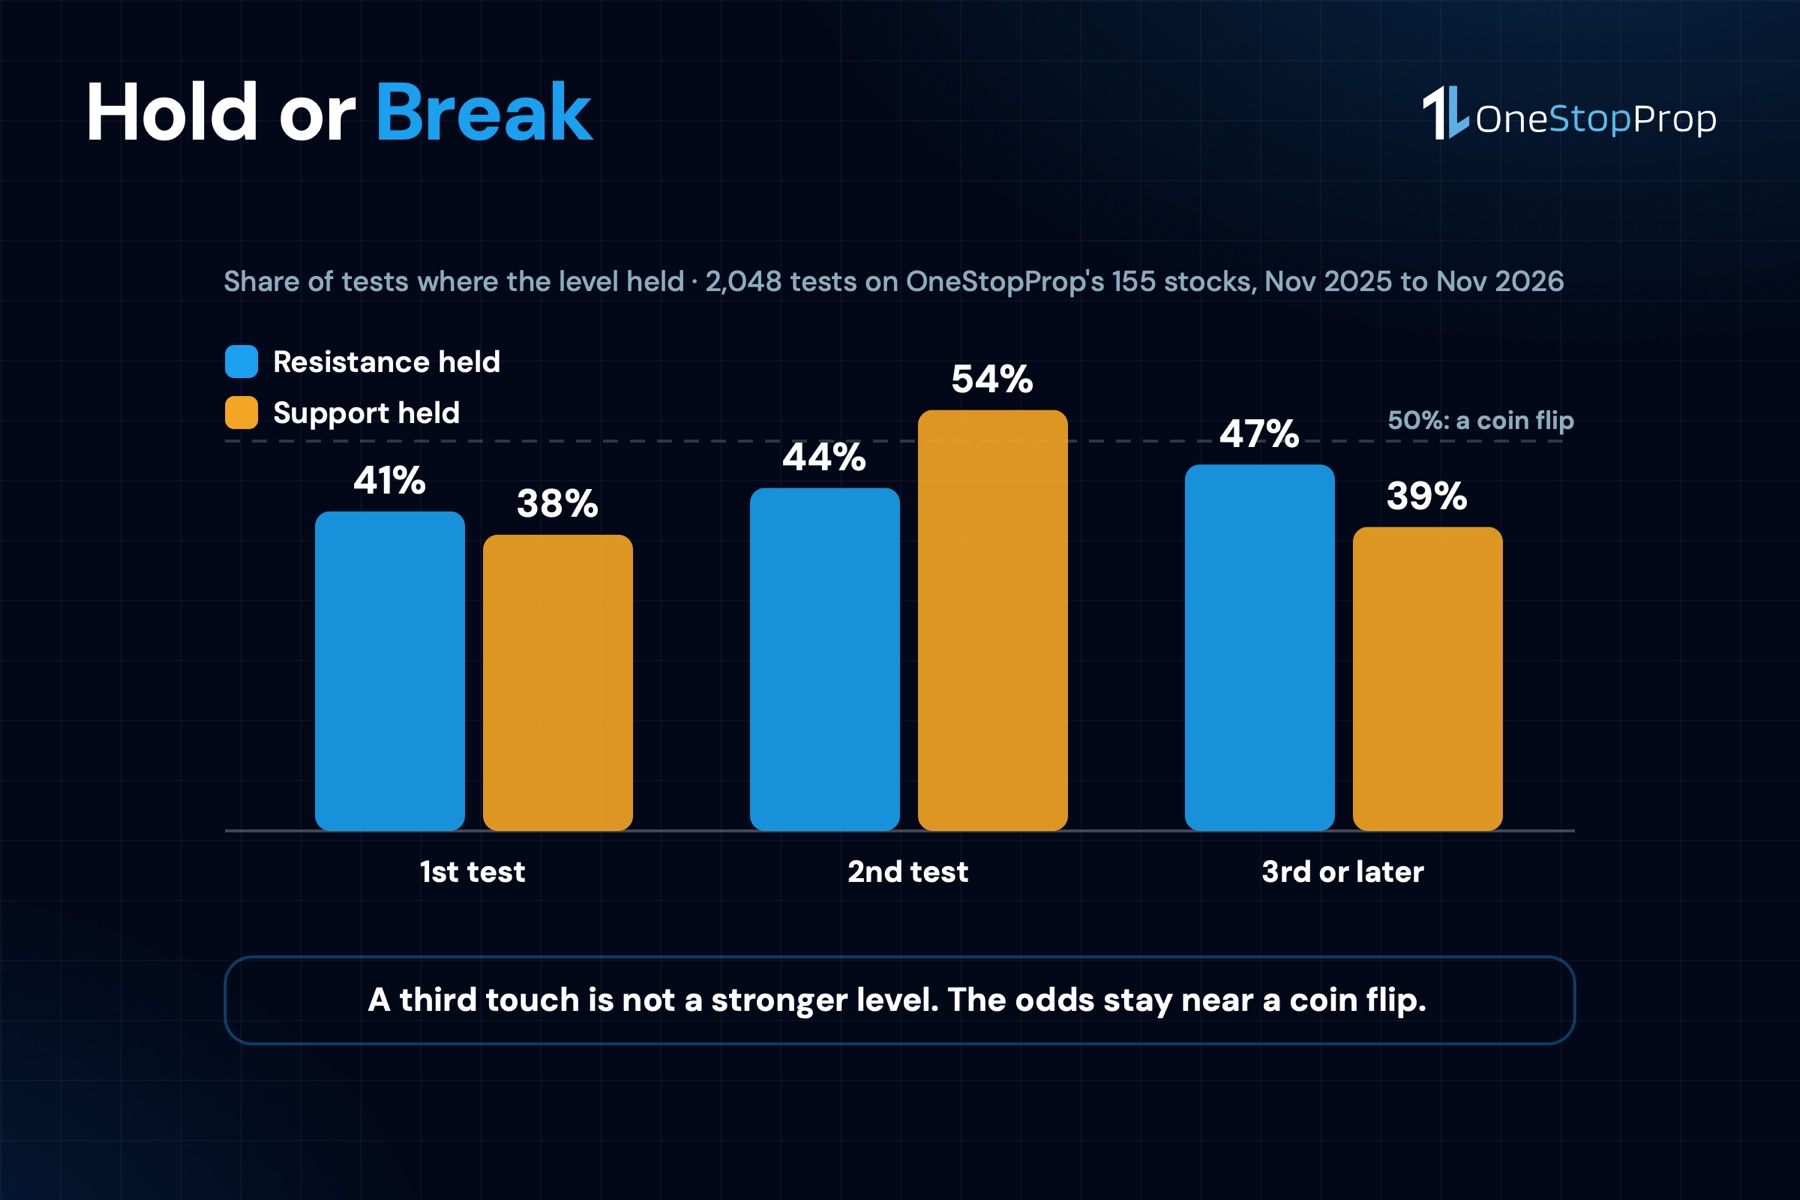
- A level is a coin with a slight bias toward breaking. Across 2,048 tests, the level held 42% of the time and broke 53%. More touches did not make it stronger: resistance held 41% on the first test, 44% on the second and 47% on the third or later.
- When a level holds, the bounce is worth having. Median move away from the level within 10 sessions: 7.7% off resistance, 10.3% off support. 85% of holds moved at least 5%.
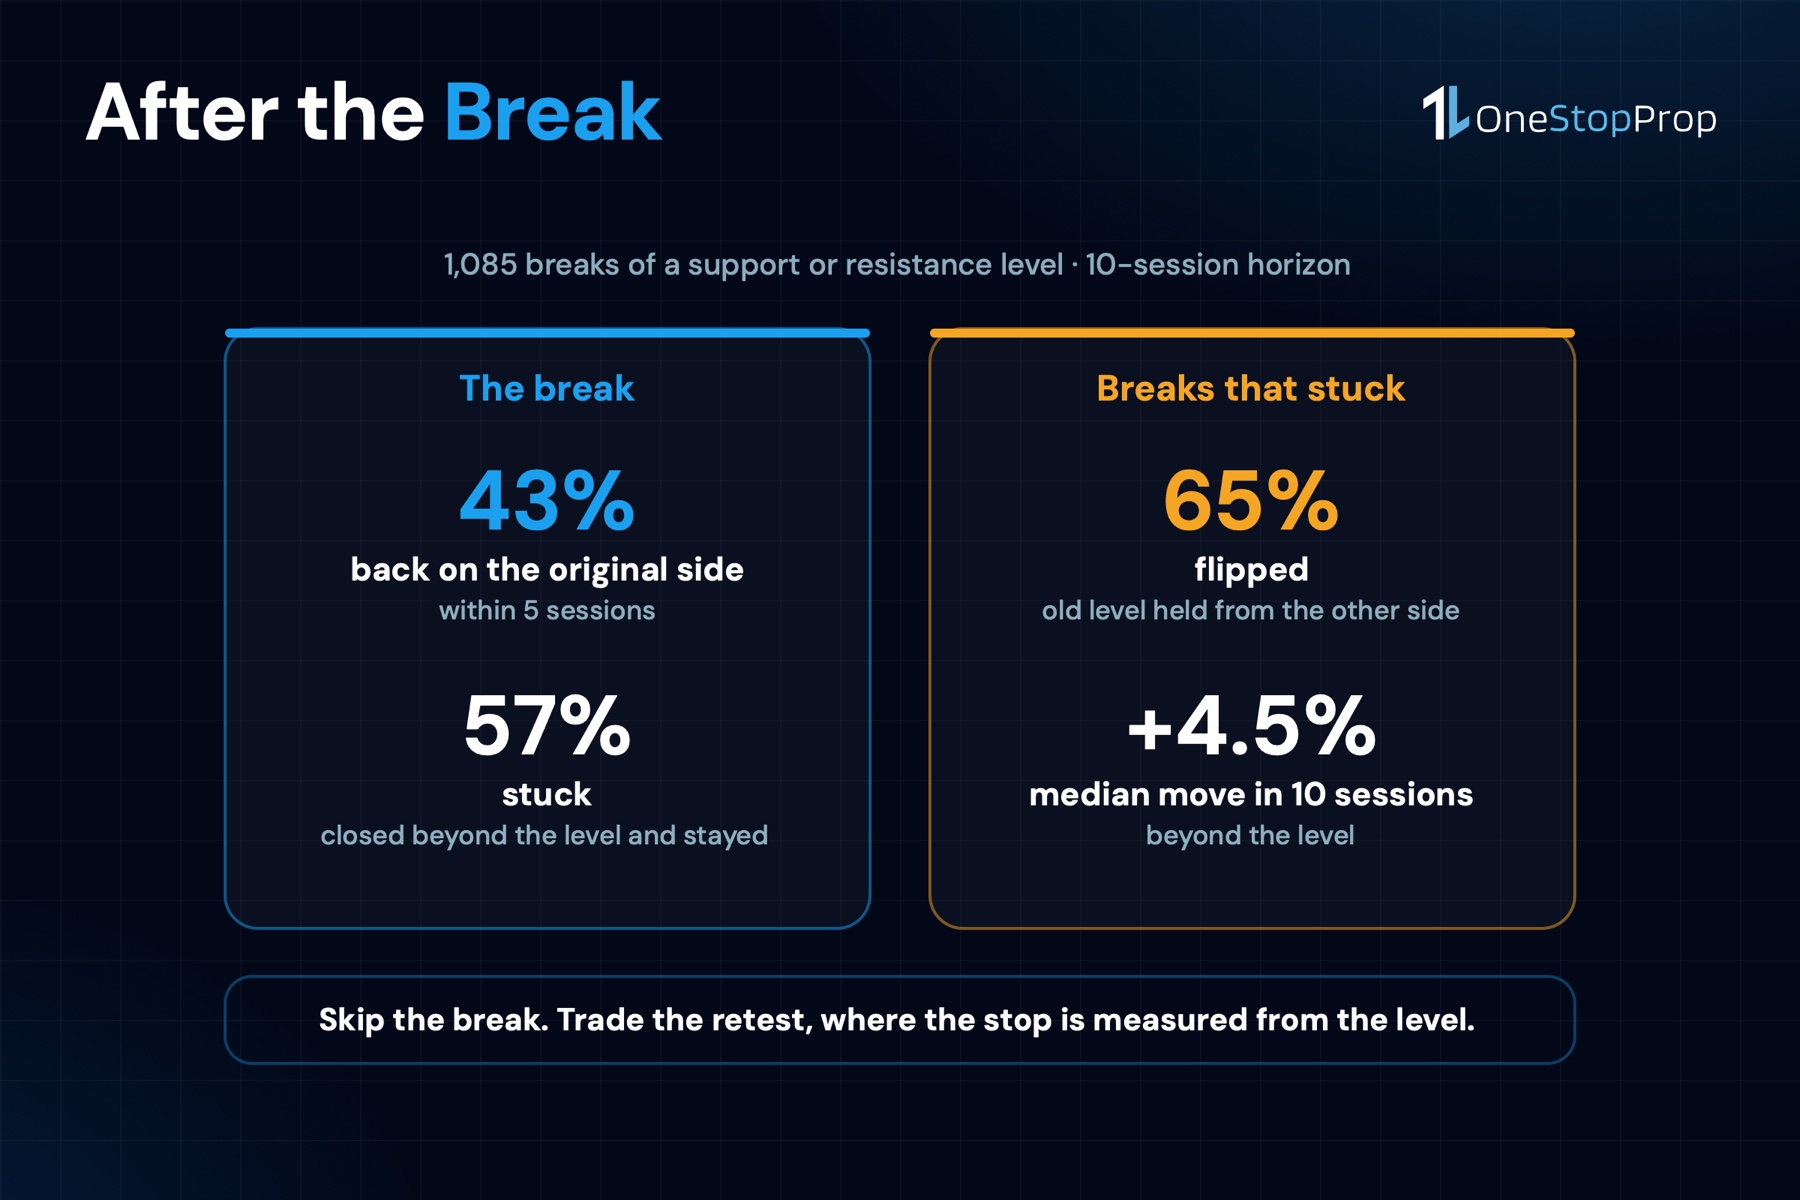
- The break is the weaker trade. 42% of resistance breaks and 44% of support breaks were back on the original side within 5 sessions. The breaks that stuck moved a median 4.5% in 10 sessions; the ones that failed, 0.9% the other way.
- The broken level flips most of the time. Of the breaks that stuck, 65% came back to the old level from the other side and held there. The retest is the entry with the smaller stop.
- The wick is the stop killer. On 24% of the holds, the test-day wick went through the level before the bounce, by a median 0.42%. On a funded account the stop goes beyond that, and the share count comes from the distance.
What Support and Resistance Are
Nasdaq’s glossary defines a support level as a price below which it is difficult for a security to fall, where the stock tends to stop falling because there is more demand than supply, identified by seeing where the stock has bottomed out in the past. A resistance level is the mirror: a price the stock has had trouble rising above, where supply has shown up before.
That is the whole idea. A level is a memory. Enough traders bought at $128 last time, or sold at $278, that the price is expected to react there again. Support and resistance trading is the practice of placing entries and stops around those memories instead of around round numbers or indicators.
2 things follow from the definition that most guides skip. A level has to come from the chart, which means it has to be measurable: a specific high or low on a specific day. And the claim that the level will hold is a probability, not a rule, which means it has to be counted. The next section does both.
How the Scan Defined a Level and a Test
The daily candles came from Nasdaq’s historical data for the stocks on OneStopProp’s instrument list; 143 of the 155 had 2 full years. The definition was written as checks so it could be run on every chart the same way.
- A level is a pivot. A session whose high is the highest of the 10 sessions on each side is a resistance level at that high. A session whose low is the lowest of 10 on each side is a support level at that low.
- A test is a return to the level. At least 10 sessions after the pivot, from the correct side, a session’s high comes within 1% of a resistance level, or its low within 1% of a support level. Tests were counted between November 3, 2025 and November 3, 2026, and a level stopped being tracked once it was broken.
- A hold means no close beyond the level by more than 1% in the next 10 sessions, and the price moved at least 3% away from the level in the bounce direction.
- A break means a close beyond the level by more than 1% within the 10 sessions.
- A failed break means the stock closed back on the original side within 5 sessions of the break.
- A flip means that within 15 sessions of a break the price returned to within 1% of the old level from the other side, and then closed at least 2% beyond it again. Old resistance holding as support, or old support holding as resistance.
That produced 1,415 levels and 2,048 tests. The median gap between a pivot and its first test was 28 sessions, about 6 weeks.
What 2,048 Tests Said
| Test number | Resistance: held | Resistance: broke | Support: held | Support: broke |
|---|---|---|---|---|
| 1st test | 41% (706 tests) | 57% | 38% (802 tests) | 52% |
| 2nd test | 44% (169) | 55% | 54% (244) | 42% |
| 3rd or later | 47% (73) | 52% | 39% (54) | 59% |
| All | 42% | 56% | 42% | 50% |
The rest of each row is “neither”: the level was not broken and the bounce did not reach 3%.
4 things to take from the table.
The level is not a wall. On the first test, resistance broke more often than it held, 57% to 41%, and so did support, 52% to 38%. In support and resistance trading that is the first number to internalize: a level alone is not an edge. What makes a level tradable is the size of the move when it holds and the position of the stop when it does not.
More touches did not mean more strength. The usual advice is that a level tested 3 times is stronger than a level tested once. In this sample, resistance held 41%, 44% and 47% on the first, second and third-plus tests, a small drift. Support went 38%, 54%, 39%: no pattern at all. The second test of support was the best single group in the scan, and the third was no better than the first.
The bounce pays. When a level held, the median move away from it within 10 sessions was 7.7% off resistance (396 holds) and 10.3% off support (458 holds). 85% of resistance holds and 91% of support holds moved at least 5%; about half of support holds moved 10% or more. A hold is not a small event.
The wick goes through first, 1 time in 4. On 24% of the holds, the test-day high went through the resistance level, or the low went through support, before the bounce. The median overshoot was 0.42%. A stop placed exactly at the level was hit on a quarter of the trades that then went the right way.
What a Break Was Worth
The break is the other half of support and resistance trading, and the half the scan liked least.
| Resistance breaks (535) | Support breaks (550) | |
|---|---|---|
| Back on the original side within 5 sessions | 42% | 44% |
| Breaks that stuck | 311 | 308 |
| Of those, flipped (retest from the other side held) | 65% | 65% |
| Median move 10 sessions after a break that stuck | +4.5% beyond the level | 4.7% beyond the level |
| Median move 10 sessions after a failed break | 0.9% back the other way | 0.6% back the other way |
Nearly half of all breaks were gone within a week. A trader who buys the close above resistance is right about 56% of the time that the level fails and then loses 42% of those to the reversal, which leaves about 1 in 3 breakouts going anywhere.
The flip is the better number. Of the 619 breaks that stuck, 65% came back to the old level from the other side and held there. That retest is the entry with the small stop: the level is right there, the wick overshoot is known, and the median move from the retest is the 4.5% to 4.7% above.
Pro Tip: on a funded account, do not trade the close through the level. Wait for it to come back. 2 breaks in 3 either failed inside a week or gave a retest, and the retest entry has a stop measured in cents instead of dollars. The opening range breakout guide uses the same retest logic on an intraday range.
A Support Level That Held 4 Times: Palantir at $128.51
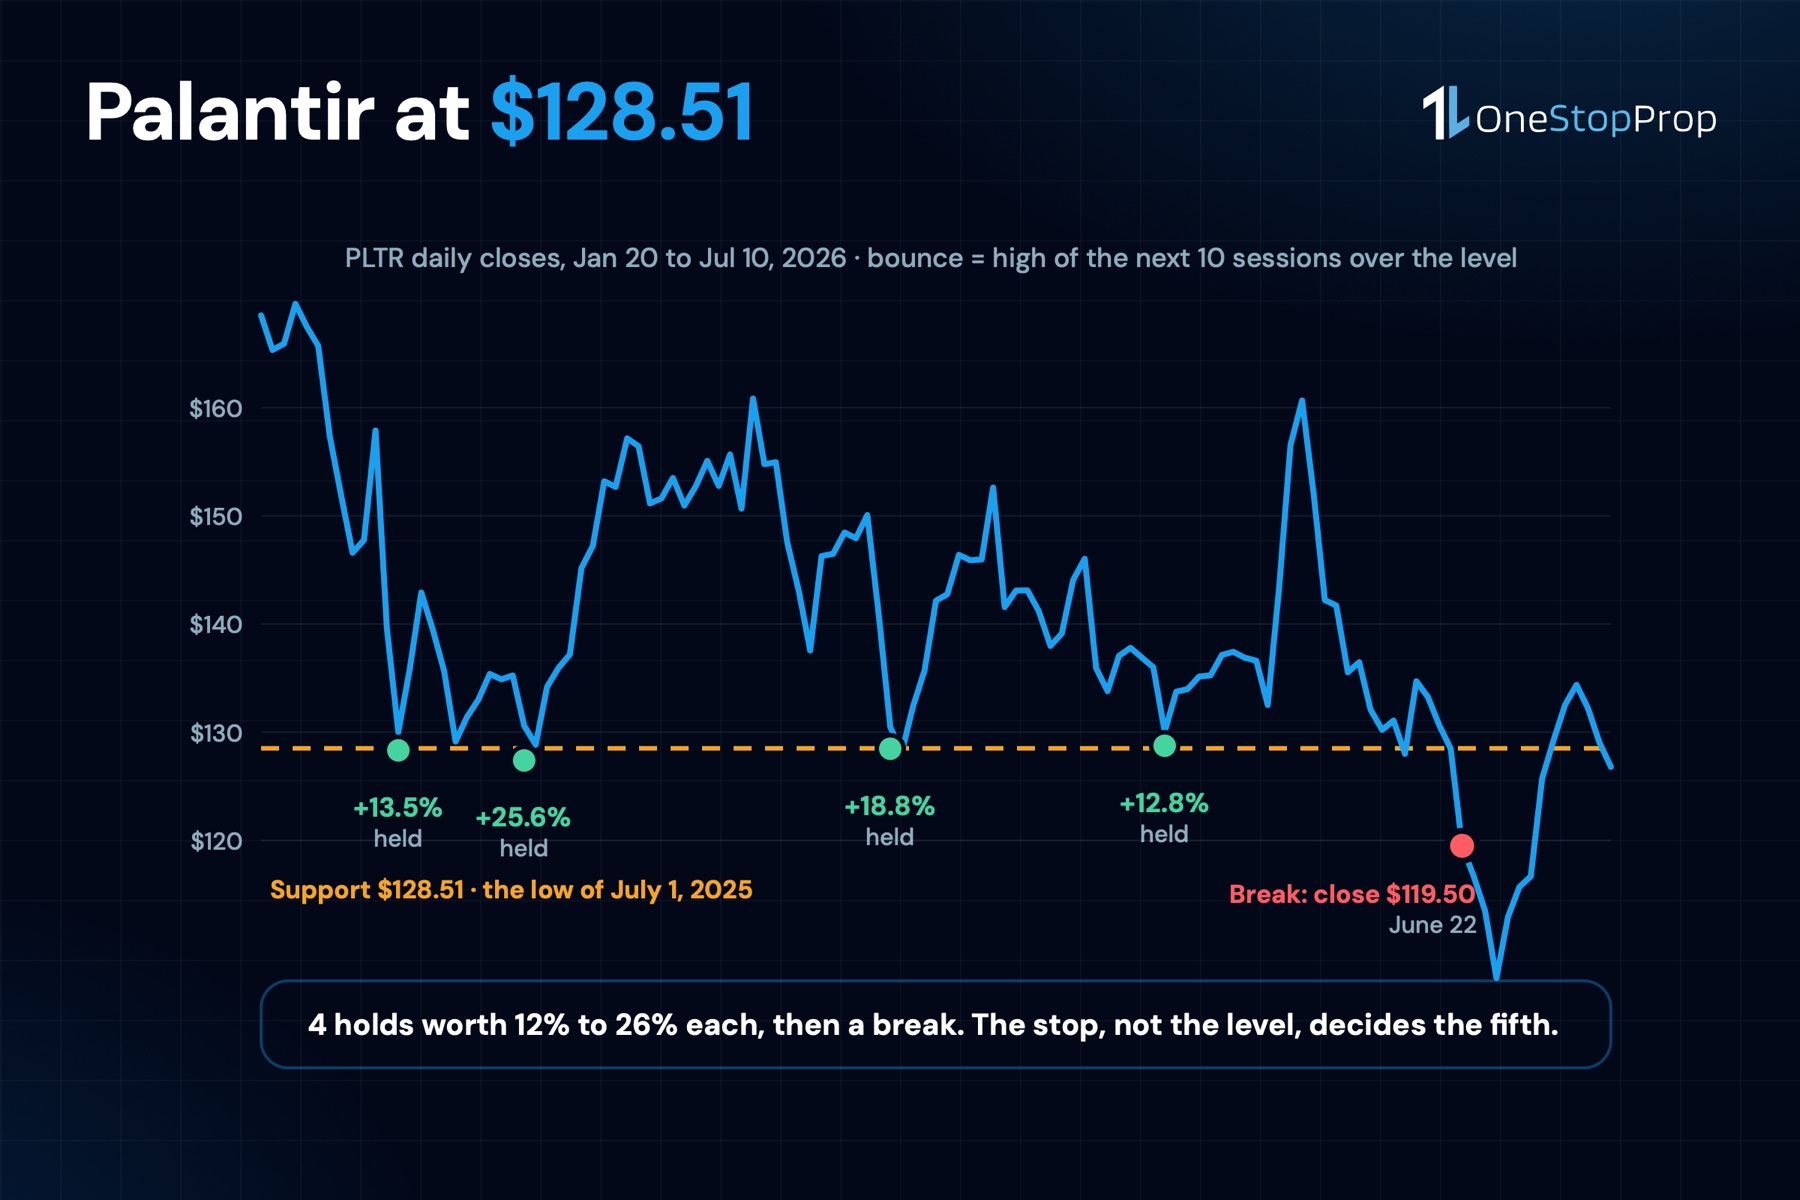
The best support level in the sample, with every price from the daily data. PLTR set a low of $128.51 on July 1, 2025, the lowest of the 10 sessions on each side.
- February 5, 2026. Low $128.32, close $130.01. The stock reached $145.87 by February 9, 13.5% above the level.
- February 23. Low $127.39, 0.9% below the level, close $130.60. High $161.45 on March 6, a 25.6% bounce.
- April 9. Low $128.47, close $130.49. $152.68 by April 22, 18.8%.
- May 13. Low $128.75, close $130.05. $145.00 by May 28, 12.8%.
- June 9. Low $127.35, close $132.07. This time the bounce did not come: PLTR closed at $119.50 on June 22, 7% through the level, a break. 10 sessions after the break it was 4.6% below the level.
4 holds in 4 months, each worth 12% to 26% within 10 sessions, and then a break. Note the wicks: on February 23 the low was 0.9% under the level, and on June 9 it was 0.9% under the level too. The session that broke the level looked, on the day, exactly like the one that held.
Here is the February 5 trade on a $100K 2 Step account with a personal risk per trade of 0.5%, which is $500.
- Entry at the close, $130.01.
- Stop 1.5% below the level, $126.58. Distance $3.43, which covers the 0.42% median overshoot 3 times over.
- Shares: $500 divided by $3.43, which is 145 shares, about $18,850 of stock as a CFD.
- 1R target: $133.44. Reached the next session.
- Highest close of the next 10 sessions: $145.87 on February 9, which is $15.86 above the entry, 4.6 times the risk.
Same arithmetic on June 9: entry $132.07, stop $126.58, distance $5.49, 91 shares, and the stop filled on the way to $119.50 for a loss of $500. That is the trade. The level does not tell you which test is the last one; the stop does.
A Resistance Level That Flipped: Microsoft at $513.73
MSFT set a high of $513.73 on August 10, 2026. It tested the level on August 28 (high $517.78, close $513.53) and fell to $486.00 within 10 sessions, a 5.4% bounce. It tested again on September 14 (high $509.95) and fell to $487.23, 5.2%.
On September 29 the stock came back, closed at $508.96, and on October 5 closed at $525.18, 2.2% through the level: a break that stuck. On October 8 it came back down to a low of $518.79 and closed at $522.61, above the old resistance. The level had flipped. 10 sessions after the break the stock was 3.9% above $513.73.
The retest entry on October 8, at $522.61 with the stop 1.5% under the old level at $506.02, risks $16.59 a share. $500 buys 30 shares. The same trade bought on the October 5 break close at $525.18 needs the same stop and risks $19.16 a share for 26 shares, and it had to sit through the 3 sessions of uncertainty that killed 42% of resistance breaks. Same level, same direction, and the retest is the better-defined trade.
Apple’s $277.84 high of January 2, 2026, the right shoulder of the head and shoulders pattern measured in that guide, did the same: it held as resistance on February 4 and February 26 with bounces of 8.1% and 8.7%, then broke on May 5 at $284.18 and ran 7.6% in 10 sessions.
Support and Resistance Trading on a Funded Account
The levels are the same on any account. 3 rules on a funded account change what you do at them.
The stop goes beyond the wick, and the wick has a size. The 0.42% median overshoot and the 24% rate mean a stop at the level is a stop that gets hit by noise. Set it 1% to 1.5% beyond the level on a stock with a normal daily range, more on a stock that moves 4% a day; the most volatile stocks guide ranks the list by that range. The distance from entry to stop is the share count: risk per trade divided by it. The trading plan template has the page where that is written before the order.
The daily loss limit is measured at midnight, from the higher of balance or equity. OneStopProp’s Help Center explains the maximum daily loss as 4% of the initial balance on 1 Step and 2 Step accounts and 2% on Instant, calculated at 12:00 AM EST from the higher of balance or equity. A support trade that holds and bounces 10% in 10 sessions is open profit at midnight, and open profit at midnight raises the next day’s floor. The trailing stop loss guide covers the exit that keeps that profit from becoming the next day’s loss.
Overnight holds are allowed, with no minimum holding time. The Help Center confirms overnight and weekend holds and no minimum holding time, so a bounce that takes 10 sessions to play out can be held. The 5-minute news window still applies on funded accounts: positions closed before and after FOMC, NFP, CPI, PPI and earnings, unless the account carries the News Trading Allowed Add-On. A level test the day before a company’s earnings is a test with a gap behind it.
6 Rules From the Numbers
- Mark levels from pivots, not from feel. A high that is the highest of 10 sessions on each side, or a low that is the lowest, is a level. Everything else is a line.
- Trade the hold with the stop beyond the wick. 1% to 1.5% past the level. 24% of holds overshoot and the median overshoot is 0.42%.
- Size from the stop distance. $500 of risk at a $3.43 stop is 145 shares; at a $16.59 stop it is 30. The share count is the output, never the input.
- Take at least 1R, and let the rest go for the median. A hold produced a median 7.7% to 10.3% move within 10 sessions and 1R usually came within a day or 2.
- Do not buy the break. Buy the retest. 42% to 44% of breaks failed within 5 sessions; 65% of the breaks that stuck came back and held. The retest has the smaller stop and the same target.
- Respect the level that just broke. Old support is the new resistance 65% of the time. The PLTR level at $128.51 held 4 times as support; after the June break it was the ceiling on the July 1 retest.
Common Mistakes in Support and Resistance Trading
Counting touches as strength
Resistance held 41%, 44% and 47% across 3 test counts; support held 38%, 54%, 39%. A third touch is not a stronger level. It is a level that has been right twice and is about to be tested again at the same odds.
Putting the stop at the level
A quarter of the holds went through the level by a median 0.42% before bouncing. A stop at the line is a stop that pays for someone else’s bounce.
Chasing the break
56% of levels break on a given test, and 42% to 44% of those breaks are gone in a week. The break close is the most expensive entry on the chart.
Ignoring the flip
After a break that sticks, the old level holds from the other side 65% of the time. A trader who stops watching a level because it broke stops watching the next entry.
Sizing for the bounce instead of the stop
A 10% bounce on a $19,000 position is a nice number, and a position that size exists only because the stop was $3.43 away. Move the stop to $10 and the position is $9,500. The bounce did not change; the risk did.
Frequently Asked Questions
What is support and resistance trading?
Placing entries, stops and targets around prices where a stock has turned before: support below the current price, where buyers showed up, and resistance above it, where sellers did. The trade is either a bounce off the level, a break through it, or a retest of a broken level from the other side.
How often do support and resistance levels hold?
On 2,048 tests across OneStopProp’s 155 stocks in the last 12 months, the level held 42% of the time and broke 53%. Resistance held 41% on the first test and 47% on the third or later; support held 38% on the first test and 54% on the second.
How far does a stock bounce off support?
When support held in this scan, the median move away from the level within 10 sessions was 10.3%, and 91% of holds moved at least 5%. Off resistance the median bounce was 7.7%.
Should you trade the breakout or the retest?
The retest. 42% of resistance breaks and 44% of support breaks were back on the original side within 5 sessions, while 65% of the breaks that stuck came back to the old level and held there. The retest has a stop measured from the level itself and the same move ahead of it.
Where do you put the stop in support and resistance trading?
Beyond the level by more than the usual wick. On 24% of the holds the wick went through the level by a median 0.42% before the bounce, so a stop 1% to 1.5% past the level clears that on most stocks. The share count is the risk per trade divided by that distance.
Can you trade support and resistance on a funded account?
Yes. Overnight holds are allowed, there is no minimum holding time, and shorting is allowed on all instruments. The daily loss limit, 4% on 1 Step and 2 Step and 2% on Instant, is measured at 12:00 AM EST from the higher of balance or equity, and the 5-minute news window applies on funded accounts without the News Trading Allowed Add-On.
The Bottom Line
Support and resistance trading works on real stocks in a specific way. The level holds less than half the time, and when it holds, the bounce is worth 7.7% to 10.3% in 10 sessions. The break fails nearly half the time within a week, and when it sticks, the old level flips 2 times in 3. The wick goes through the level on a quarter of the good trades.
Put together, that is a plan: mark pivots, buy the hold with the stop beyond the wick, skip the break and take the retest, and let the stop distance set the size. On a funded account the plan has a daily loss limit measured at midnight attached to it, which is the reason the stop distance comes first.
If you want to run that plan on an account where the loss limits are written down before the first level is drawn, start a funded account at OneStopProp: 1 Step, 2 Step or Instant, from $10K to $300K, with U.S. stock CFDs on the same list this scan used, overnight holds allowed and no time limit on the challenge.
Sources
- Support level, Nasdaq glossary. A price level below which it is difficult for a security to fall, where demand exceeds supply, identified from past bottoms. https://www.nasdaq.com/glossary/s/support-level
- Resistance level, Nasdaq glossary. The mirror definition for a level above the current price. https://www.nasdaq.com/glossary/r/resistance-level
- Historical Quotes, Nasdaq. Daily candles for the 155 stocks on OneStopProp’s instrument list, 2 years to November 3, 2026, used for the 2,048-test scan and the PLTR, AAPL and MSFT examples. https://www.nasdaq.com/market-activity/quotes/historical
- Stop Order, U.S. Securities and Exchange Commission. A stop order becomes a market order when the stop price is reached. https://www.sec.gov/answers/stopord.htm
- What Instruments Can I Trade?, OneStopProp Help Center. The U.S. stock CFD list the scan covered. https://help.onestopprop.com/faq/what-instruments-can-i-trade/
- What is the Maximum Daily Loss?, OneStopProp Help Center. 4% of the initial balance on 1 Step and 2 Step, 2% on Instant, measured at 12:00 AM EST from the higher of balance or equity. https://help.onestopprop.com/faq/what-is-the-maximum-daily-loss/
- Can I hold trades overnight and over weekends? and Is there a minimum holding time?, OneStopProp Help Center. Overnight holds allowed; no minimum holding time. https://help.onestopprop.com/faq/can-i-hold-trades-overnight-and-over-weekends/
- Is news trading allowed?, OneStopProp Help Center. The 5-minute window around FOMC, NFP, CPI, PPI and earnings on funded accounts, and the News Trading Allowed Add-On. https://help.onestopprop.com/faq/is-news-trading-allowed/
- Is shorting allowed?, OneStopProp Help Center. Shorting allowed on all instruments. https://help.onestopprop.com/faq/is-shorting-allowed/