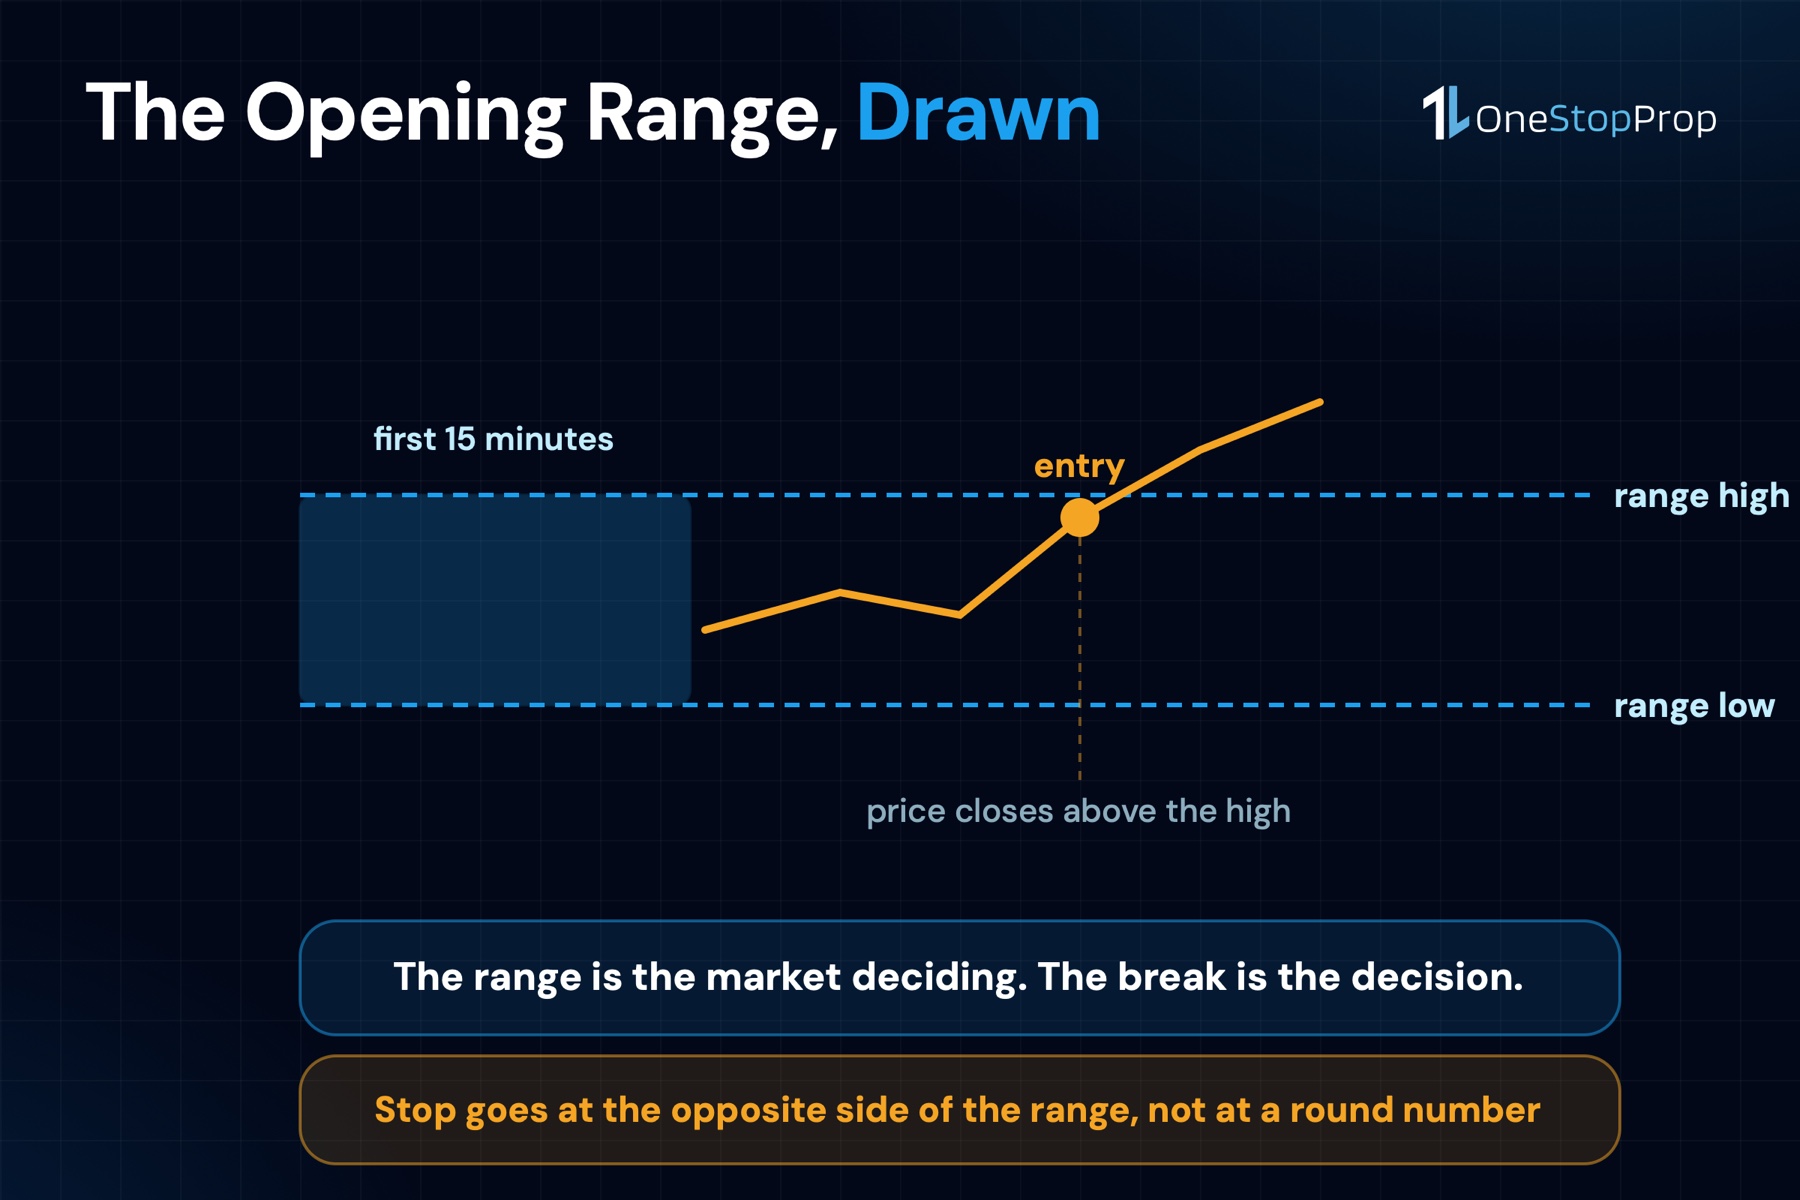
The first 30 minutes of the U.S. trading session are unlike any other window in the day. Overnight sentiment, pre-market gaps, and institutional order flow all collide the moment the bell rings at 9:30 AM ET. Out of that collision, a definable price structure emerges, one that experienced traders have been exploiting for decades. The opening range is the high-low of the first N minutes, commonly 5, 15, or 30 minutes after the 9:30 ET open. The opening range breakout (ORB) strategy builds an entire trade around that structure: mark the range, wait for a confirmed directional break, and enter with defined risk.
For a trader operating inside a funded account, the ORB strategy has a particular appeal. Setups occur early in the session, stop distances are clearly defined by the range itself, and the 9:30 to 11:00 AM window aligns neatly with the highest-volume, highest-momentum period of the day. The catch is that funded accounts carry hard daily loss limits that punish oversized positions in ways a personal account never would. Understanding how to size every ORB trade within those limits is what separates a disciplined funded trader from one who blows the account on an impulsive opening gap play.
This guide covers the complete ORB framework for stocks, from defining the range through stock selection, confirmation filters, position sizing inside a funded account’s daily loss limit, and the most common mistakes that end challenges prematurely.
Key Takeaways
- The 15-minute ORB offers the best balance of signal reliability and trade frequency. According to TradeAlgo’s ORB backtesting analysis, the 15-minute opening range produces a 56% win rate with an average reward-to-risk ratio of 1.8:1 on the S&P 500 over 10 years, therefore use it as your default unless the stock’s volatility profile demands otherwise.
- Volume confirmation is non-negotiable. Research cited by TradeAlgo shows that volume-confirmed breakouts produce a 64% win rate compared to 48% for breakouts without volume confirmation, a gap large enough to mean the difference between a profitable month and a losing one.
- Size from the daily loss limit, not the account balance. As ThorTradeCopier’s funded account sizing guide explains, the daily loss limit (DLL) is the binding constraint on any single session, sizing against the full account balance can eat through a DLL in 2 trades, ending the trading day before lunch.
- VWAP alignment matters on every ORB signal. Long breakouts above VWAP and short breakouts below VWAP have higher follow-through rates, therefore only enter long ORB trades when price is simultaneously above VWAP, and only enter short ORB trades when price is below it.
- The Magnificent 7 stocks are well-suited to ORB trading. Apple (AAPL), NVIDIA (NVDA), Microsoft (MSFT), Amazon (AMZN), Alphabet (GOOGL), Meta (META), and Tesla (TSLA) all carry the liquidity and volatility needed to form clean opening ranges and generate meaningful post-breakout moves.
Quick-Start Prioritization Framework
| Strategy Variant | Best For | Effort Level | Time to Signal |
|---|---|---|---|
| 15-minute ORB with VWAP + volume | Most funded traders | Medium | 9:45 AM ET |
| 30-minute ORB with trend filter | Conservative / wide-range stocks | Low | 10:00 AM ET |
| 5-minute ORB with volume spike | High-volatility earnings plays | High | 9:35 AM ET |
| Retest entry after breakout | Traders who prefer limit orders | Medium | Varies |
| Fade the false breakout (short) | Experienced traders only | High | Varies |
Start here if you’re:
- New to ORB: Use the 15-minute range with VWAP confirmation and a 1.5x average-volume filter. This is the most forgiving variant for building pattern recognition without excessive false signals.
- Trading a volatile Mag 7 stock: Consider the 30-minute range on Tesla (TSLA) or NVIDIA (NVDA) on high-news days. The wider range creates a more meaningful stop level and reduces whipsaw risk.
- On a OneStopProp Pro Account: News trading is permitted, making the 5-minute ORB viable on earnings catalyst days, enter faster, tighten stops to the range midpoint, and use the tighter 20% consistency threshold to guide how you spread profits across the cycle.
What the Opening Range Actually Is (and Why It Works)
The Logic Behind the First Candles
The early range reflects overnight order imbalance resolution; a sustained break suggests the dominant side for the day. In other words, the opening range is a price discovery event. Market makers, institutions, and retail traders are all simultaneously processing overnight news, pre-market prints, and futures levels. The high and low that emerge from that first window represent the market’s initial consensus on fair value.
The initial minutes of a trading session are marked by frenzied activity, as overnight and pre-opening news gets rapidly factored into prices and orders are executed. During this phase of early price discovery, a trading range often takes form, aptly termed the opening range. When price eventually escapes that range with conviction, it signals that one side, buyers or sellers, has won the opening auction and is now driving price with real momentum.
Choosing Your Time Window
The 3 windows traders use in practice are the first 15 minutes (9:30 to 9:45), the first 30 minutes (9:30 to 10:00), and the first 60 minutes (9:30 to 10:30). Pick one before the session opens and do not change it mid-day.
The FBS trading academy’s ORB guide offers a practical filter for the range width itself: the opening range should be at least 0.2% of the stock’s price. On a $500 NVDA, that means a range of at least $1.00 is required for the setup to qualify, if the range is tighter than that, the false breakout risk rises sharply and the trade loses its statistical edge. Discard setups that do not clear this filter.
Narrow Range Days as a Catalyst Signal
Trader and researcher Toby Crabel was among the first to document ORB in systematic form. The NR7 trading strategy was introduced by Toby Crabel in his 1990 book, ‘Day Trading with Short-Term Price Patterns and Opening Range Breakout.’ The strategy focuses on identifying the narrowest trading range over a seven-day period. His core insight: Crabel found the opening range breakout trade to be most effective after a Narrow Range 7 (NR7) day, a day where the range is the narrowest of the last 7 days. This often precedes a breakout or trend day. Therefore, screen for NR7 conditions the evening before to build a shortlist of stocks where the ORB setup has additional historical backing.
Step-by-Step: How to Trade the Opening Range Breakout
Step 1, Define the Range Before the Bell
Open your TradingView chart (the platform used for charting at OneStopProp) to a 5-minute timeframe. Set an alert or draw a session box starting at 9:30 AM ET. Do not touch the chart or form any directional bias during the opening window itself, just let the range build. Pick one window before the bell. Mark the high and the low when the window closes. Those 2 prices are the range.
Pro Tip: Identify your candidate stocks the night before by scanning for gap-ups or gap-downs with pre-market volume above 500,000 shares, then shortlist names from liquid, high-volume instruments. ORB works best on liquid high-volume stocks and ETFs like SPY, QQQ, AAPL, and TSLA. On a OneStopProp account, the Magnificent 7, Apple (AAPL), NVIDIA (NVDA), Microsoft (MSFT), Amazon (AMZN), Alphabet (GOOGL), Meta (META), and Tesla (TSLA), all meet this criteria and are available for trading.
Step 2, Apply Confirmation Filters
Once the range window closes, switch to alert mode. Entry requires a close beyond the OR boundary on the timeframe you tracked the range on. Not a wick. Not an intrabar print. A close.
Beyond that candle close, 2 additional filters must fire before you execute:
Volume filter: The breakout bar must print at least 1.5x the recent average volume, weeding out thin, low-conviction moves. Volume below that threshold is a skip signal, regardless of how compelling the price action looks.
VWAP filter: A bullish confluence is established if the price breaks above the initial high while simultaneously maintaining a position above the VWAP. Conversely, for a short ORB, price must break the opening range low while remaining below VWAP. If the price breaches the range but stays below the VWAP on a long attempt, it often indicates a “buyer’s trap” lacking genuine institutional backing.
When all 3 conditions align simultaneously, candle close outside the range, volume at 1.5x or higher, and correct VWAP positioning, that is the entry signal.
Step 3, Set Stop-Loss and Profit Target Before Entering
The stop sits just inside the opposite side of the range. On a long, the stop sits a few ticks below the OR low if the range is small, or below the breakout candle low if the range is wide.
For the profit target, trendsandbreakouts.com’s ORB framework recommends the measured move approach: take the height of the opening range (range high minus range low) and project it from the breakout level. That projection becomes the first scale-out target. A 30-minute Apple (AAPL) range of $1.60 projects a first target of $1.60 above the breakout level, with runners held past it toward prior-day highs. Profit targets should typically exceed the stop by 2 to 3 times, supporting a solid risk-reward ratio.
Pro Tip: Never enter an ORB trade without having both the stop-loss and profit target calculated and ready to enter into the order system before clicking the trade button. Pre-market preparation eliminates emotional decision-making once the breakout fires.
Step 4, Execute, Then Manage
Enter the position at market or with a stop-limit order just above the confirmation candle close. Once filled, place your stop immediately. When the stop is at the opposite side of the range, the trade thesis is simple: if price returns there, the breakout has failed. Moving the stop wider turns a defined-risk setup into an open-ended loss.
Scale out at the measured move target, then trail the remainder using the 9 EMA on the 5-minute chart. Close the position entirely before 11:30 AM ET, after that window, ORB momentum typically fades and the risk-reward ratio of holding deteriorates.
Position Sizing Inside a Funded Account’s Daily Loss Limit
Why the Standard 1% Rule Breaks Down on Funded Accounts
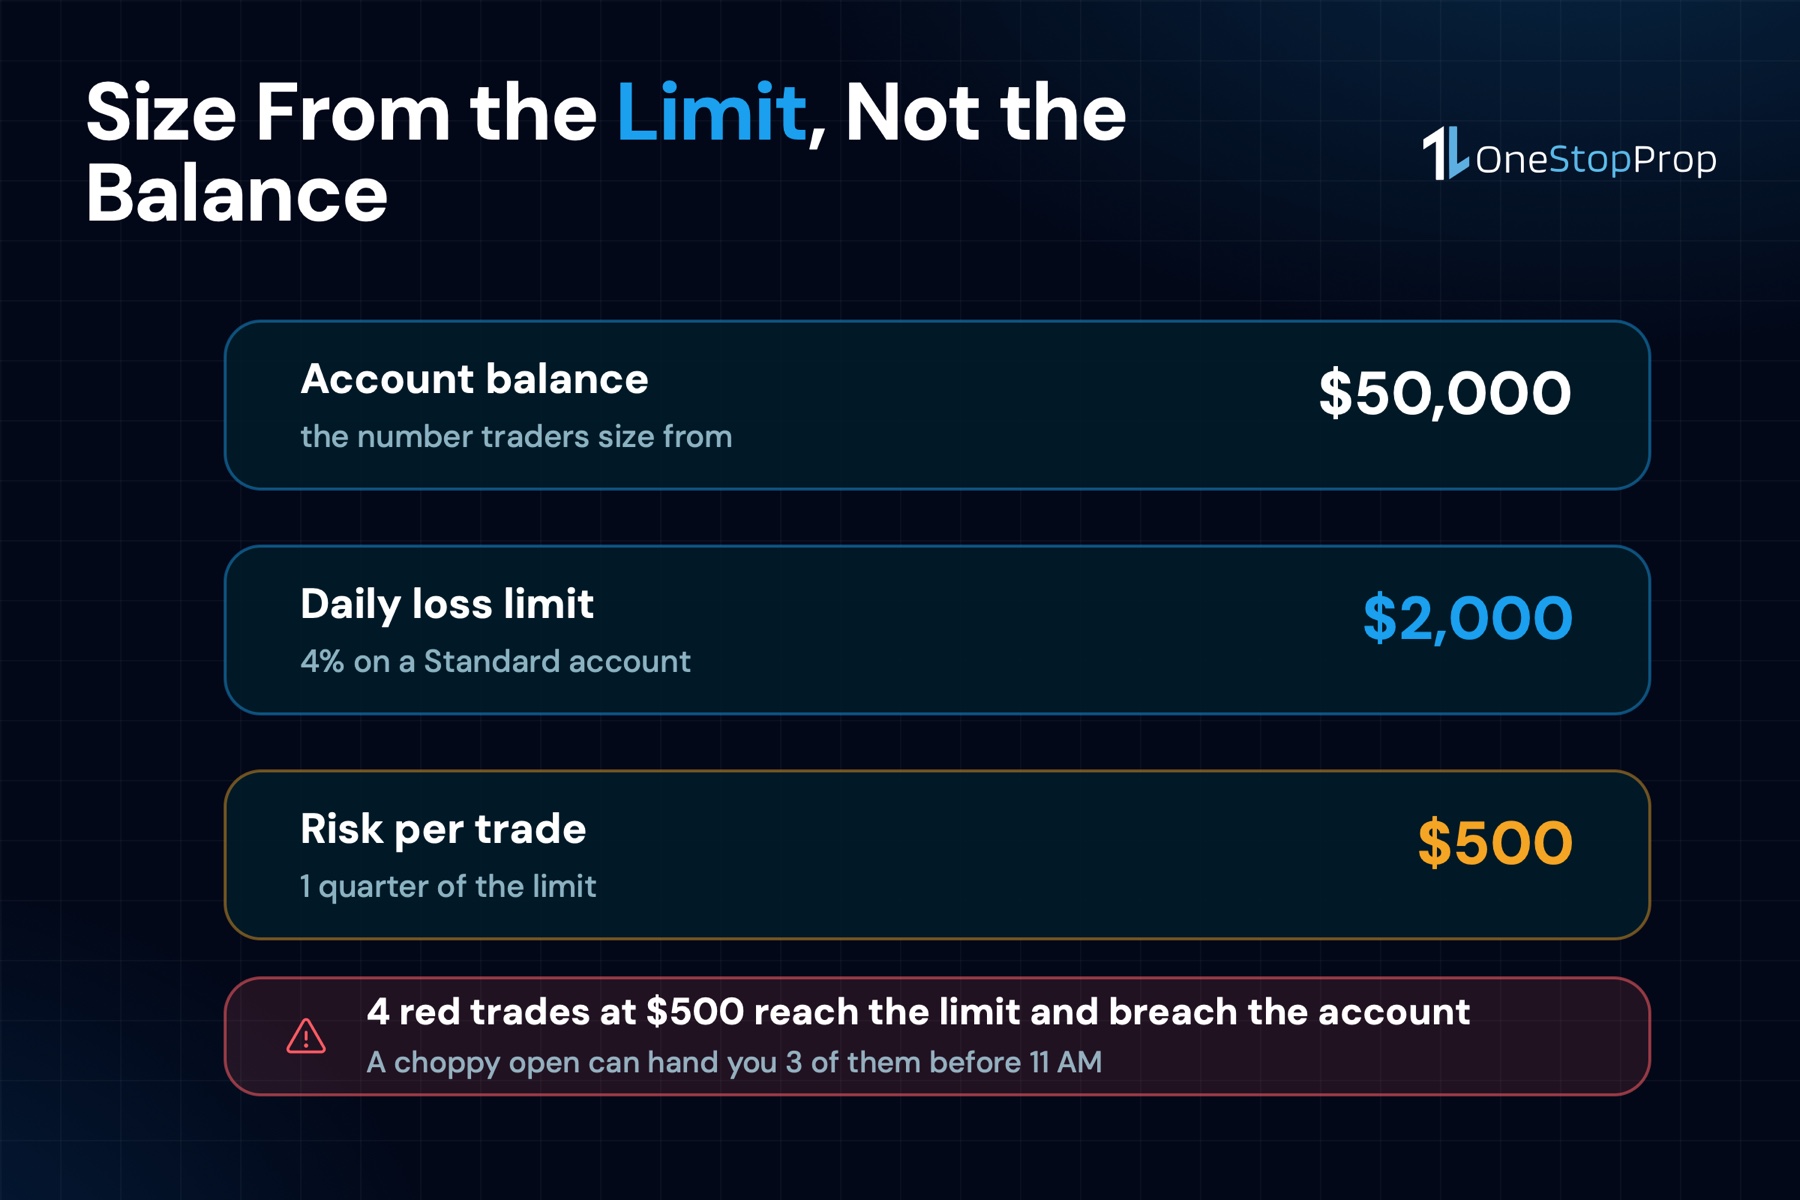
The single most common mistake funded traders make with ORB is carrying over their personal account sizing habits. 2 limits govern a funded account, and on any single trading day the daily loss limit is the binding one, not the max drawdown. Be precise about what that limit does: reaching it does not lock the account for the day, it breaches the account. There is no tomorrow on it.
Risk 1% of a $50K balance, which is $500 per trade, against the $2,000 daily loss limit a Standard $50K account carries, and 4 red trades end the account. Morning breakouts cluster: a choppy open can hand you 3 of those before 11 AM. That is the math that ends evaluations, not a string of bad setups.
The fix is to size from the right number. On a funded account that number is your daily loss limit and your remaining drawdown buffer, not your account balance.
The Practical Sizing Formula for ORB Trades
The formula audacity.capital’s ORB risk guide uses is straightforward:
Position size = planned dollar risk ÷ risk per share
Risk per share on an ORB trade equals the distance from your entry to the opposite side of the opening range. If Apple (AAPL) has an opening range low of $183.40 and you enter a long at $185.15, your risk per share is $1.75.
Now work backward from the daily loss limit. On a OneStopProp $100K Standard 2-Step account, the max daily loss is 4% of the initial balance, which is $4,000. A workable rule is to risk no more than one-third of the DLL on any single trade, that means a maximum per-trade risk of roughly $1,333. At $1.75 risk per share on the AAPL trade above, that allows roughly 762 shares per trade.
Pro Tip: Set a personal daily stop that sits below the firm’s limit. If OneStopProp’s DLL is $4,000, consider setting your own stop at $2,500 to $2,800. The personal daily stop should be less than the firm’s daily limit. If the firm allows a $2,000 loss, your personal daily stop might be $1,400. This buffer protects against the emotional urge to “make it back” after a bad morning.
Worked Example: NVDA ORB on a $100K Account
Tesla (TSLA) opens and forms a 15-minute range with a high of $185.00 and a low of $183.00, a $2.00 range. Price breaks above $185.00 at 9:52 AM on 1.9x average volume, with VWAP at $183.50, confirming the long bias.
- Entry: $185.05 (breakout close)
- Stop: $182.95 (just below range low)
- Risk per share: $2.10
- Account DLL: $4,000 (OneStopProp $100K Standard)
- Max per-trade risk (one-third of DLL): $1,333
- Position size: $1,333 ÷ $2.10 = 634 shares
- First target: $185.00 + $2.00 (range projection) = $187.00
If that target hits, the gain on 634 shares at $1.95 profit is $1,236, roughly 0.9x the DLL risk budget, and the account is not threatened regardless of outcome.
Stock Selection: Matching the ORB to the Right Name
Characteristics of a Good ORB Candidate
ORB suits liquid stocks and index futures with participative opening volume. In practice, that means average daily volume above 5 million shares, a price above $50 (to make per-share stop distances meaningful), and a clear catalyst, an earnings report, a product announcement, or a macro event that creates pre-market directional bias.
Avoid thinly traded small-caps for ORB. Stocks with average daily volume below 1 million shares produce wide spreads that erode profitability and make it difficult to exit at your stop price.
The Magnificent 7 as Default ORB Instruments
The 7 largest-cap stocks by market capitalization, Apple (AAPL), NVIDIA (NVDA), Microsoft (MSFT), Amazon (AMZN), Alphabet (GOOGL), Meta (META), and Tesla (TSLA), are all available on OneStopProp and represent some of the cleanest ORB instruments in the market. Each name carries deep intraday liquidity, tight spreads, and enough daily range to create meaningful stop-distance relative to position size.
NVDA experiences significant volatility whether it’s in play or not. On earnings days or major news events, the stock has averaged a one-day move of +/- 9.6 percent over 15 quarters, with a standard deviation of 8.68% on post-earnings days, making it essential to create meaningful stop-distance relative to position size. On earnings days or major macro releases, NVDA’s opening range tends to be wide and clean, ideal for the 30-minute ORB variant. On TSLA, traders bracket the 15-minute range and trigger a long entry if price breaks above the range high or a short entry if price breaks below the range low.
Aligning the ORB Direction with the Bigger Picture
Align the ORB direction with the bigger picture. If a stock has been trending up on the daily chart, bullish ORB breakouts (above the range) are more reliable than bearish ones. A simple rule: check whether the stock is above or below its 20-day simple moving average before the session opens. Long ORB setups on stocks above the 20 SMA, short setups on stocks below. Counter-trend ORBs carry lower probability and should require an even stronger volume confirmation, at least 2x average, not merely 1.5x.
Common ORB Mistakes That Cost Funded Traders Their Accounts
Entering Before the Range Is Complete
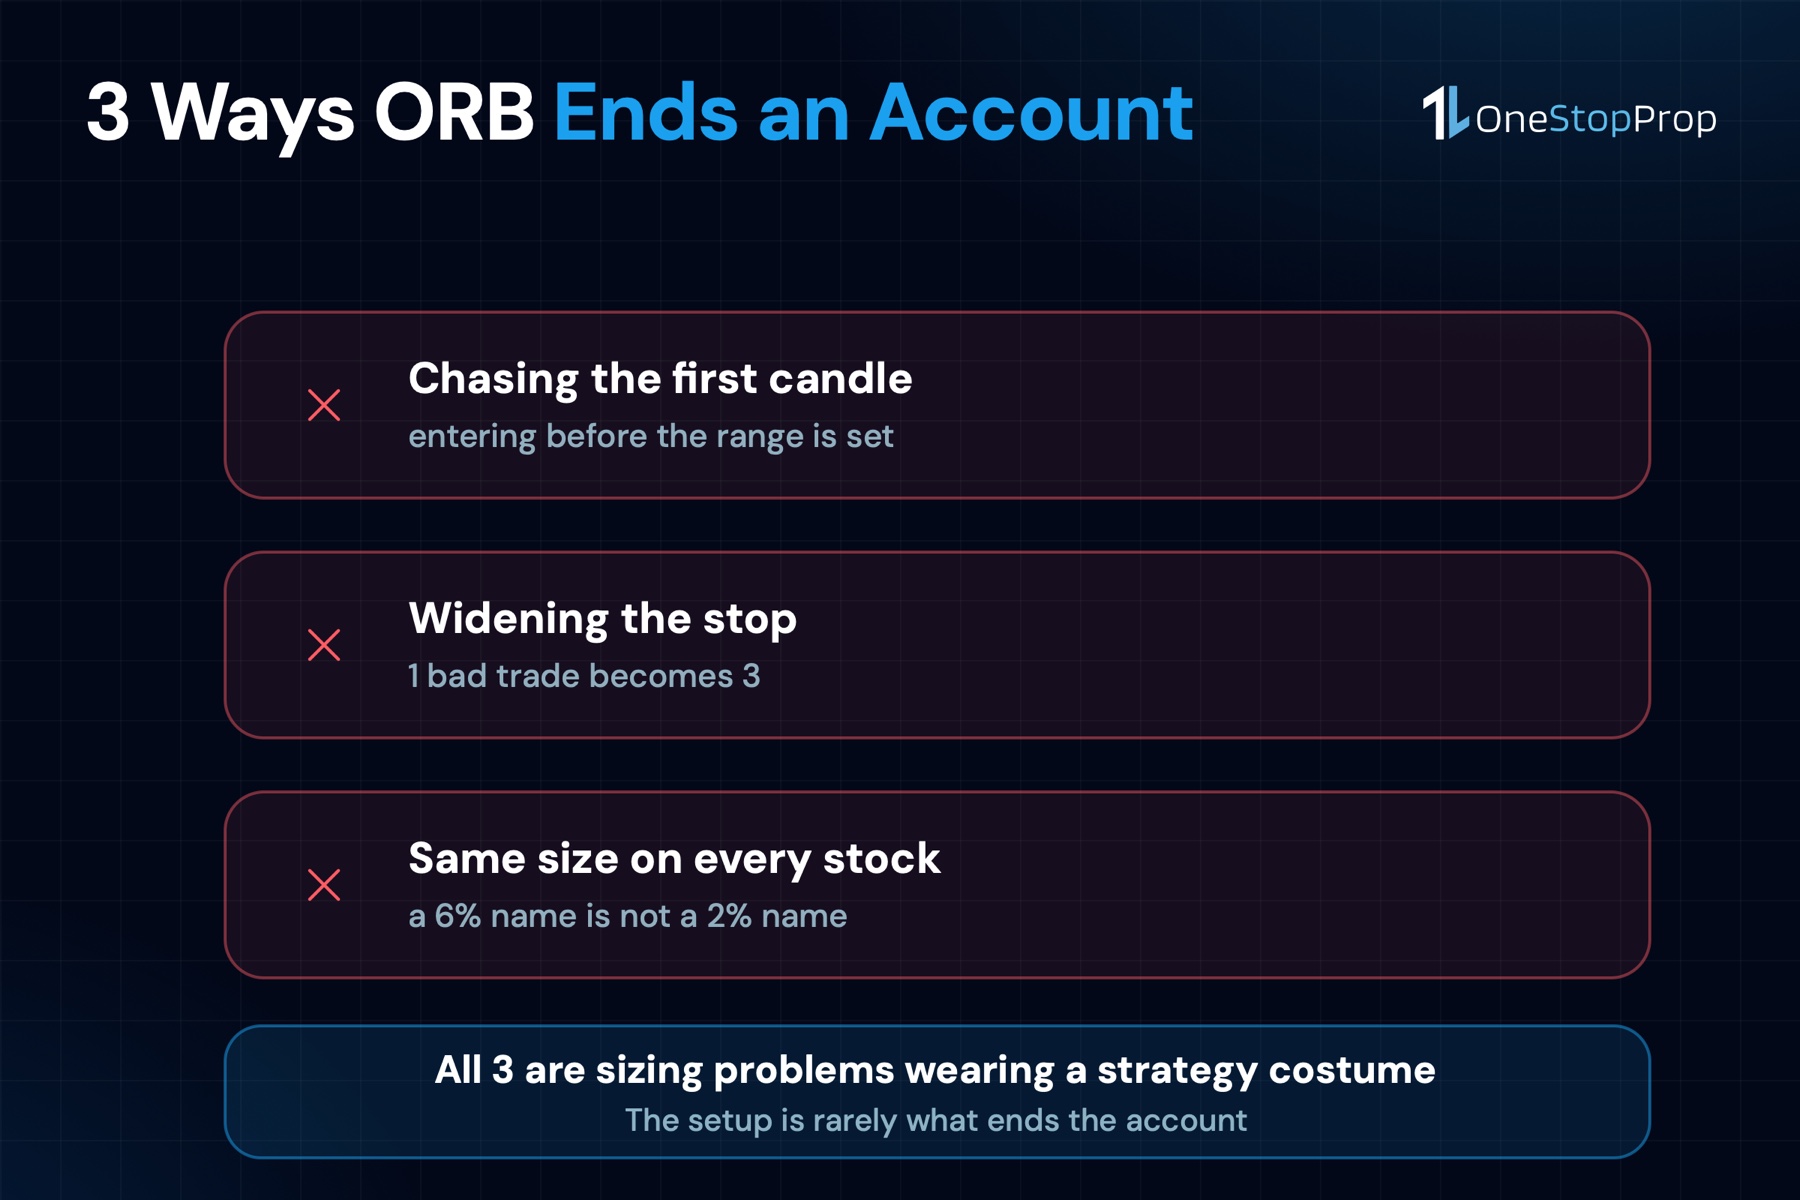
Impatient traders jump in before the opening range finishes forming, guessing the direction. This eliminates the entire statistical edge of ORB. Wait for the full 5, 15, or 30 minutes. The breakout setup only exists once the range is defined. Trading inside the range window is guessing, not trading an established strategy.
Ignoring Volume Confirmation
One of the biggest challenges in ORB trading is dealing with false breakouts. A stock may briefly move above the opening range high or below the range low, attracting traders into the trade, only to quickly reverse direction. This usually happens when the breakout lacks strong buying or selling participation.
Tracking volume on every ORB entry as a journal habit, rather than eyeballing it, is what separates traders who learn from a false breakout from those who keep paying for the same one. Set a rule: if volume is below 1.5x average on the breakout candle, the trade does not exist. Move on.
Chasing Extended Breakouts
One of the most frequent mistakes is chasing extended breakouts. You see a stock rocket through its opening range high and run hard without you. FOMO kicks in. You jump in late, often right as the early birds are cashing out and taking profits. This almost guarantees you get the worst possible price, right before a pullback. In a funded account, this error compounds: you take a large loss at an extended entry, and the stop is now wider than it would have been at the confirmation candle, meaning position size was likely too large for the actual risk.
Widening Stops After Entry
Widening stops after entering a bad trade is one of the most account-threatening behaviors in funded trading. The ORB stop is structural: if price returns to the opposite side of the opening range, the breakout has failed. Accept it, exit, and wait for the next setup. The daily loss limit makes this discipline non-negotiable, widening a stop on a bad trade is how 1 bad trade becomes 3 bad trades stacked on top of each other.
Trading ORB on Low-Volatility Days
When the opening range is extremely narrow on below-average volume, the market lacks conviction. These setups produce choppy, indecisive breakouts. Check pre-market volume and overnight range before committing. A simple filter: if the pre-market range on your candidate stock is less than half the average true range (ATR) of the last 10 sessions, consider skipping the ORB and waiting for a day with more energy.
Using OneStopProp for ORB Trading
OneStopProp is built as a stock-first prop firm. Traders access stocks, forex, and crypto inside a single funded account, with charts running on TradingView, the same platform most ORB traders already use for marking opening ranges and setting volume alerts. Execution runs on Match-Trader.
For the ORB strategy specifically, the account structure at OneStopProp has several characteristics worth noting. The max daily loss is 4% of the initial balance on the Standard 2-Step account, resetting at 12:00 AM ET on the higher of balance or equity. On a $100K account, that is a $4,000 DLL, a meaningful buffer for a disciplined ORB trader running 1 to 2 setups per session at one-third DLL risk per trade. Overnight and weekend holds are permitted, and shorting is permitted on all instruments, making both long and short ORB setups available without restriction.
The OneStopProp Pro Account adds an important dimension for traders who run ORB around earnings catalysts: news trading is permitted on Pro accounts only. This matters because some of the cleanest ORB setups arise on earnings gap-up or gap-down days, where pre-market momentum creates a clear directional bias. On a Standard account, trading around major news events requires additional caution. On a Pro account, the restriction is removed.
Consistency rules exist at OneStopProp. The thresholds are: Standard 1-Step and 2-Step at 25%, and Pro 1-Step and 2-Step at 20%. This means no single trading day in a payout cycle can account for 25% (Standard) or 20% (Pro) of total profits. For ORB traders, this is a practical sizing consideration: if you are near the end of a payout cycle, avoid running maximum position size on a single high-conviction breakout, as a large single-day gain could delay the payout.
Pro Tip: Run the consistency math before each session during the final week of a payout cycle. Know exactly how much profit a single day’s trade can add before hitting the 25% or 20% threshold, and size down on especially strong ORB signals to protect payout eligibility without leaving the trade entirely off the table.
Frequently Asked Questions
What is the opening range breakout strategy?
The Opening Range Breakout (ORB) strategy enters a position after a breakout above or below a symbol’s early trading range. The range is defined as the high-low of the first 5, 15, or 30 minutes after the market opens at 9:30 AM ET. The trade is entered when price closes outside that range on above-average volume, with a stop at the opposite side of the range and a profit target equal to at least the range’s full width projected from the breakout level.
Which opening range timeframe is best for beginners?
The 15-minute opening range is the best starting point. The 5-minute range produces too many false breakouts for newer traders, while the 30-minute range reduces the number of setups. The 15-minute variant balances signal quality with trade frequency. Once you have tracked 30 to 50 trades in a journal and have a clear picture of your personal false breakout rate, you can experiment with the 5-minute variant on high-momentum days.
How do I size an ORB trade on a funded account?
Start with the firm’s daily loss limit (DLL), not the account balance. Risk no more than one-third of the DLL on any single trade. Divide that dollar amount by the distance from your entry to the stop-loss (the range opposite side) to get your maximum share count. On a $100K OneStopProp Standard 2-Step account with a $4,000 DLL, the maximum per-trade risk is roughly $1,333. If the ORB stop distance on AAPL is $1.75 per share, the maximum position is 761 shares. Size your position to match the stop distance, never the other way around.
What stocks work best for the ORB strategy?
The opening range breakout strategy works best on US stocks and stock indices such as the S&P 500 and Nasdaq. For individual stocks, focus on liquid names with average daily volume above 5 million shares and a clear pre-market catalyst. The Magnificent 7, AAPL, NVDA, MSFT, AMZN, GOOGL, META, and TSLA, are consistently the strongest ORB candidates because of their deep intraday liquidity and tendency to form clean, well-defined opening ranges.
How does the VWAP filter improve ORB accuracy?
The VWAP functions as an anchor of institutional value. A breakout above the opening range high is only viewed as a high-probability event if the price is also trending above the VWAP, confirming that the bullish impulse is supported by actual traded volume. Requiring VWAP alignment on every ORB entry does not eliminate false breakouts entirely, but it eliminates the weakest category of false signals, those where price pokes through the range but the overall institutional consensus is still positioned against the breakout direction.
Can I trade ORB short as well as long inside a funded account?
Yes. Shorting is permitted on all instruments at OneStopProp. Price breaks above ORH but quickly reverses back below it, a failed breakout. Instead of chasing the break, the fade setup shorts when price falls back inside the range after the false break above. Trapped longs create selling pressure on the reversal. Both clean breakdowns and fade setups are valid. The same position sizing rules apply regardless of direction: size from the DLL, stop at the opposite range boundary, and confirm with volume and VWAP before entry.
Putting It All Together
The opening range breakout strategy is one of the most durable intraday setups in U.S. equities because it is built on a real market mechanism, the resolution of overnight order imbalance in the first minutes of trading. When that mechanism produces a clean, high-volume, VWAP-aligned break, the statistical edge is real and the risk is clearly defined.
For funded account traders, the strategy offers something particularly valuable: stop placement is determined by the market (the opposite side of the range), not by an arbitrary dollar figure. That mechanical stop allows you to work backward precisely to a share count that respects the daily loss limit without guessing or eyeballing. The discipline of sizing from the DLL is what allows you to take 3 or 4 ORB setups per week without ever being at risk of breaching the firm’s account rules on a single trade.
If you are ready to apply the ORB framework on a funded account, explore the Standard and Pro account options at OneStopProp. The $100K Standard 2-Step account provides the 4% DLL structure outlined in this guide, while the Pro account adds news-trading permission for earnings-catalyst ORB setups. Both paths allow you to trade the full Magnificent 7 universe on TradingView without switching platforms or instruments.
Sources
- ORB + Volume + VWAP Breakout, TradingView / echanxyz. Institutional-grade filter description for VWAP and volume alignment. https://www.tradingview.com/script/7khuDtm8-ORB-Volume-VWAP-Breakout/
- Payout Information and Guidelines, OneStopProp. Official payout rules, consistency thresholds, and cycle details. https://help.onestopprop.com/faq/payout-rules/
- Best Prop Firms for Stock Traders in 2026, OneStopProp. Account structure, payout cadence, and Pro account features. https://onestopprop.com/best-prop-firms-for-stock-traders-in-2026/
- Why Traders Are Leaving Traditional Prop Firms in 2026, OneStopProp. Consistency rules and drawdown parameters plainly stated. https://onestopprop.com/why-traders-are-moving-away-from-traditional-prop-firms-the-onestopprop-difference/