Risk of ruin is the probability that a run of losses takes you out of the game before your edge has time to work. On your own account that means going to zero. On a funded account it means something closer: touching the max total loss, or the max daily loss, which ends the account while most of the balance is still sitting there.
That difference changes the arithmetic more than most traders expect. The formula still works, but the “capital” in it is the distance to the line, and on a funded account that distance is a few percent of the balance, so the number of losses that fit is small and the risk per trade decides almost everything.
This guide does the math 3 ways. The classic formula, explained without jargon. 3 worked examples on OneStopProp’s routes, with every division shown. And a simulation of 100,000 traders per setting, 60 settings, run against OneStopProp’s actual loss limits.
Key Takeaways
- Risk of ruin has 2 inputs: your edge (win rate and payoff) and how many losses fit before the line. The classic formula is ((1 minus edge) divided by (1 plus edge)), raised to the number of units. Fewer units, higher risk of ruin, no matter how good the edge.
- On a funded account, “units” is the max total loss divided by the risk per trade. On a $100K 1 Step account the max total loss is 6%, so 1% risk per trade is 6 units, not 100.
- Risk per trade moves ruin more than win rate does. A 50% win rate at 1.5:1 on 1 Step had under a 0.1% chance of ruin at 0.25% risk, 1.8% at 0.5%, 12.1% at 1% and 29.7% at 2%. Same trader, same edge, 4 different outcomes.
- With zero edge, size does nothing. A 40% win rate at 1.5:1 breaks even, and 57% to 58% of those traders touched the 1 Step total loss line at every risk level tested: with no edge the odds are just the distance to the target against the distance to the line.
- The daily limit sets the pace; the total loss decides the ruin. Stopping for the day 1 loss short of the daily limit keeps the account alive; it does not change the odds of the next trade. The max total loss decides the ruin.
What Risk of Ruin Measures
Investor.gov defines risk as the degree of uncertainty about the return on an asset and the harm that follows when returns are not what the investor expected. Risk of ruin narrows that to a single question: before your strategy produces the result its averages promise, what is the chance that a losing streak takes away the capital you need to keep playing?
It is a probability between 0 and 1, and it is not expectancy. A strategy can make money on the average trade and still carry a 30% chance of ruin, because averages arrive over a long run and ruin happens along the way.
The SEC puts the warning on day trading in plain words: it is extremely risky and can result in substantial losses in a very short period of time. Risk of ruin is the number that says how short that period can be.
3 things decide it: the win rate, the payoff ratio (how much a winner pays compared to what a loser costs), and the number of units, which is how many losses in a row land you on the line. The third one is the input traders get wrong on a funded account.
The Risk of Ruin Formula, Without the Jargon
The problem is 300 years old and goes by the name gambler’s ruin. Grinstead and Snell’s Introduction to Probability, the Dartmouth textbook published by the American Mathematical Society, works it out in Section 12.2 for a player who wins each round with probability p and loses with probability q.
The book’s answer for a player with z units of capital against an opponent with unlimited money is short. If the odds are against the player, ruin is certain. If the odds favor the player, the probability of eventual ruin is (q divided by p), raised to the power z.
Trading books write the same thing with an “edge” instead of p and q. The edge is the win rate minus the loss rate: a 55% win rate has an edge of 0.10. Since p is (1 plus edge) over 2 and q is (1 minus edge) over 2, q over p is the same as (1 minus edge) over (1 plus edge), and the formula becomes:
Risk of ruin = ((1 minus edge) divided by (1 plus edge)) raised to the number of units.
Take a 55% win rate at a 1:1 payoff, risking 1 unit per trade, with 6 units between you and the line. The ratio is 0.90 over 1.10, which is 0.818. Raised to the 6th power, that is 0.30. A 30% chance of touching the line before the edge pays.
With 12 units instead of 6, the same 0.818 to the 12th power is 0.09. Halving the risk per trade took ruin from 30% to 9%. The exponent is where the control is.
When there is a finish line
A funded account has a finish line, the profit target, and the game ends when either line is touched. Grinstead and Snell give that version too: with z units to the loss line and M units from the loss line to the target, ruin is ((q over p) to the M, minus (q over p) to the z), divided by ((q over p) to the M, minus 1).
When the game is fair, p equals q, it collapses to something a trader can do in their head: ruin is the distance to the target divided by the total distance between the lines. 8% to the target and 6% to the line gives 8 over 14, or 57%. That number comes back in the simulation.
The version with a payoff ratio
The textbook assumes winners and losers are the same size. Most trading plans do not. When a winner pays k times a loser, ruin is still a number between 0 and 1 raised to the number of units, except that the number is no longer q over p.
Call it theta. Theta is the value between 0 and 1 that solves: theta equals the win rate times theta raised to the (k plus 1), plus the loss rate. For a 1:1 payoff that gives back q over p. For 2:1 and 1.5:1 it is solved numerically, which the script behind this guide does, except the 50% at 2:1 case, which has an exact answer; the worked examples show the result for each case.
Pro Tip: before you compute anything, write down the 2 lines in dollars and divide each by your risk per trade. On a $100K 1 Step account that is $4,000 and $6,000. If the second division gives a number under 12, the formula will say your size is too big before you look at the win rate.
Why “Ruin” on a Funded Account Is Not Zero
On a personal account the line is $0, which is why the usual numbers look comfortable: 100 units at 1% risk puts almost any positive edge near zero ruin. On a funded account the line is drawn by the rules, much closer.
OneStopProp’s maximum daily loss is 4% of the initial balance on 1 Step and 2 Step accounts and 2% on Instant. It is measured at the 12:00 AM EST day change from the higher of balance or equity, and it resets at 12:00 AM EST each day.
The max total loss is static: 6% of the initial balance on 1 Step, 8% on 2 Step, 5% on Instant. The Help Center’s example is a $100,000 2 Step account, where $100,000 times 8% is $8,000, so equity including floating positions must not hit or fall below $92,000.
| Route, $100K account | Max daily loss | Max total loss | Finish line |
|---|---|---|---|
| 1 Step | 4% ($4,000) | 6% ($6,000) | 8% profit target |
| 2 Step | 4% ($4,000) | 8% ($8,000) | 8% target, then 5% in phase 2 |
| Instant | 2% ($2,000) | 5% ($5,000) | 6% payout buffer |
Instant has no profit target, so the finish line used here is the one its payout rules set: a buffer equal to 6% of the account size before profits can be withdrawn.
So the capital that goes into the formula is not $100,000. On 1 Step it is $6,000, and risking $1,000 a trade there is 6 units, the same as a gambler with 6 chips.
3 Worked Examples, Every Division Shown
Each example uses a $100K account, a fixed dollar risk per trade, and a win that pays the stated multiple of that risk. The formula’s number is for the no-finish-line case; the simulation’s includes the finish line and the daily limit.
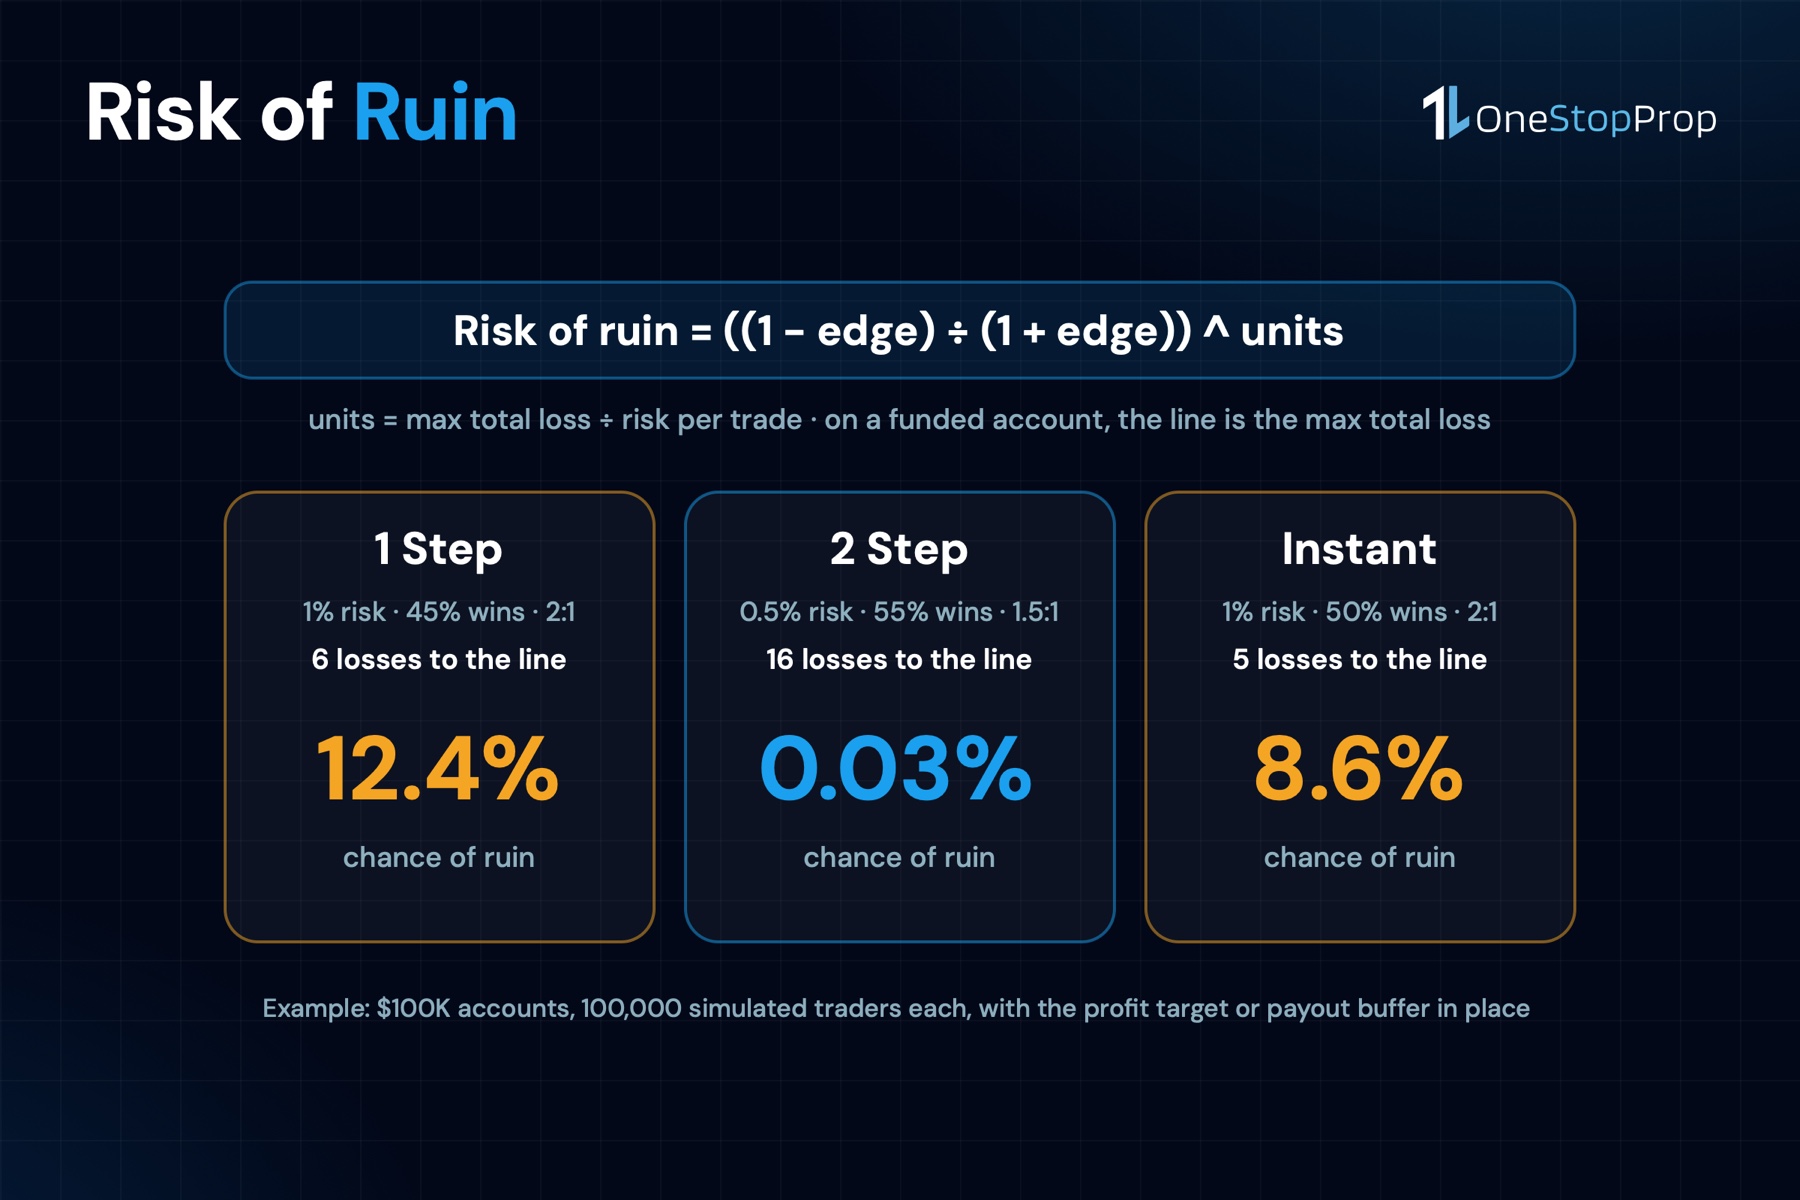
Example 1: 1 Step, 1% risk, 45% win rate, 2:1 payoff
Risk per trade: 1% of $100,000 is $1,000. A winner pays $2,000.
Daily line: $4,000 divided by $1,000 is 4. The 4th straight loss in a day lands on the daily limit.
Total line: $6,000 divided by $1,000 is 6. 6 straight losses from the starting balance land on the max total loss. Units = 6.
Expectancy per trade: 0.45 times 2, minus 0.55 times 1, is 0.90 minus 0.55, which is 0.35 units per trade: the average trade is worth 0.35 times the risk on it. Positive, even with a win rate under 50%.
Theta: solve theta equals 0.45 times theta cubed plus 0.55. The answer is 0.7134 (check: 0.7134 cubed is 0.3631, times 0.45 is 0.1634, plus 0.55 is 0.7134). Ruin with no finish line is 0.7134 to the 6th power, which is 13.2%.
With the 8% target in place, the simulation gave 12.4%. Of 100,000 traders with this profile, 87.6% reached the target, in a median of 16 trades, and 12.4% touched the $94,000 line before the target, about 1 in 8.
Example 2: 2 Step, 0.5% risk, 55% win rate, 1.5:1 payoff
Risk per trade: 0.5% of $100,000 is $500. A winner pays $750.
Daily line: $4,000 divided by $500 is 8. The 8th straight loss in a day lands on the daily limit.
Total line: $8,000 divided by $500 is 16. Units = 16.
Expectancy: 0.55 times 1.5, minus 0.45, is 0.825 minus 0.45, which is 0.375 units per trade.
Theta for a 1.5:1 payoff at 55% is 0.6095. Raised to the 16th power that is 0.0004, or 0.04%. The simulation agreed: 0.03% of traders touched the line in phase 1, 0.03% in phase 2, and 99.9% passed both. The median path to the 8% target was 39 trades.
Compare it with example 1. The edge is similar, 0.375 against 0.35 units per trade, and the chance of ruin, by the formula, is more than 300 times smaller, because 16 units sit between the trader and the line instead of 6. The price is time: 39 trades to the target instead of 16, which a challenge with no time limit lets you pay.
Example 3: Instant, 1% risk, 50% win rate, 2:1 payoff
Risk per trade: 1% of $100,000 is $1,000. A winner pays $2,000.
Daily line: $2,000 divided by $1,000 is 2. 2 losses and the day is over, because the second one lands on the 2% limit. A trader who wants to stay on the right side of that line stops after 1 loss, and that is what the simulated trader did.
Total line: $5,000 divided by $1,000 is 5. Units = 5.
Expectancy: 0.5 times 2, minus 0.5, is 0.5 units per trade.
Theta: solve theta equals 0.5 times theta cubed plus 0.5. That one has an exact answer, 0.618. Raised to the 5th power it is 0.090, or 9.0%. The simulation, with the 6% buffer as the finish line, gave 8.6%: 91.4% of traders reached the buffer in a median of 9 trades, 8.6% touched the $95,000 line before reaching the buffer.
Cut the risk to 0.5%, 10 units instead of 5, and the simulated ruin fell to 0.8%. The win rate did not move. The exponent did.
What 100,000 Simulated Traders Did
The formula assumes an endless sequence with no finish line and no daily limit. To see what OneStopProp’s rules do to it, this guide ran a Monte Carlo simulation: for every combination of win rate (40, 45, 50, 55, 60%), payoff (1:1, 1.5:1, 2:1) and risk per trade (0.25, 0.5, 1, 2% of the initial balance), 100,000 traders each took a sequence of trades under these rules:
- 3 trades a day, a fixed pace, so the daily limit has something to bind on.
- The daily limit, obeyed. A trader stops for the day when 1 more loss would land on the daily line (4% on 1 Step and 2 Step, 2% on Instant) and continues the next day. The day’s losses are counted without netting its wins, which is stricter than the rule, so the simulated trader stops earlier than the rulebook requires.
- Ruin. Equity hits or falls below the max total loss line: 6%, 8% or 5% of the initial balance by route.
- Success. Equity reaches the finish line: the 8% target on 1 Step and 2 Step phase 1, 5% on 2 Step phase 2, the 6% payout buffer on Instant. On 1 Step and 2 Step that is the challenge; the funded phase runs on the same loss lines with the 4% payout buffer as the first finish line, so the same arithmetic applies there.
The random seed is fixed, so the run is reproducible. In the 1:1 cases on 1 Step, where both lines are a whole number of units and the textbook’s finite formula applies, the simulation matched it to within 0.2 percentage points at every setting. Where a line is not a whole number of units, 2.5 on Instant at 2% risk and 2.5 to the phase 2 target on 2 Step at 2%, the formula does not apply and the simulation is the only number.
1 Step at 1% risk per trade:
| Win rate | 1:1 payoff | 1.5:1 payoff | 2:1 payoff |
|---|---|---|---|
| 40% | 96.4% ruin | 57.4% | 26.5% |
| 45% | 85.1% | 29.3% | 12.4% |
| 50% | 57.1% | 12.1% | 5.6% |
| 55% | 25.4% | 4.6% | 2.3% |
| 60% | 8.4% | 1.6% | 0.9% |
Read the 1:1 column first. A 55% win rate at even money is a real edge, and at 1% risk on 1 Step it still touched the line 1 time in 4. At 60%, 1 time in 12.
Now read across a row. At 50%, moving the payoff from 1:1 to 2:1 took ruin from 57% to 5.6%. The payoff is the second lever, and the risk reward ratio guide has the break-even win rate for each setting.
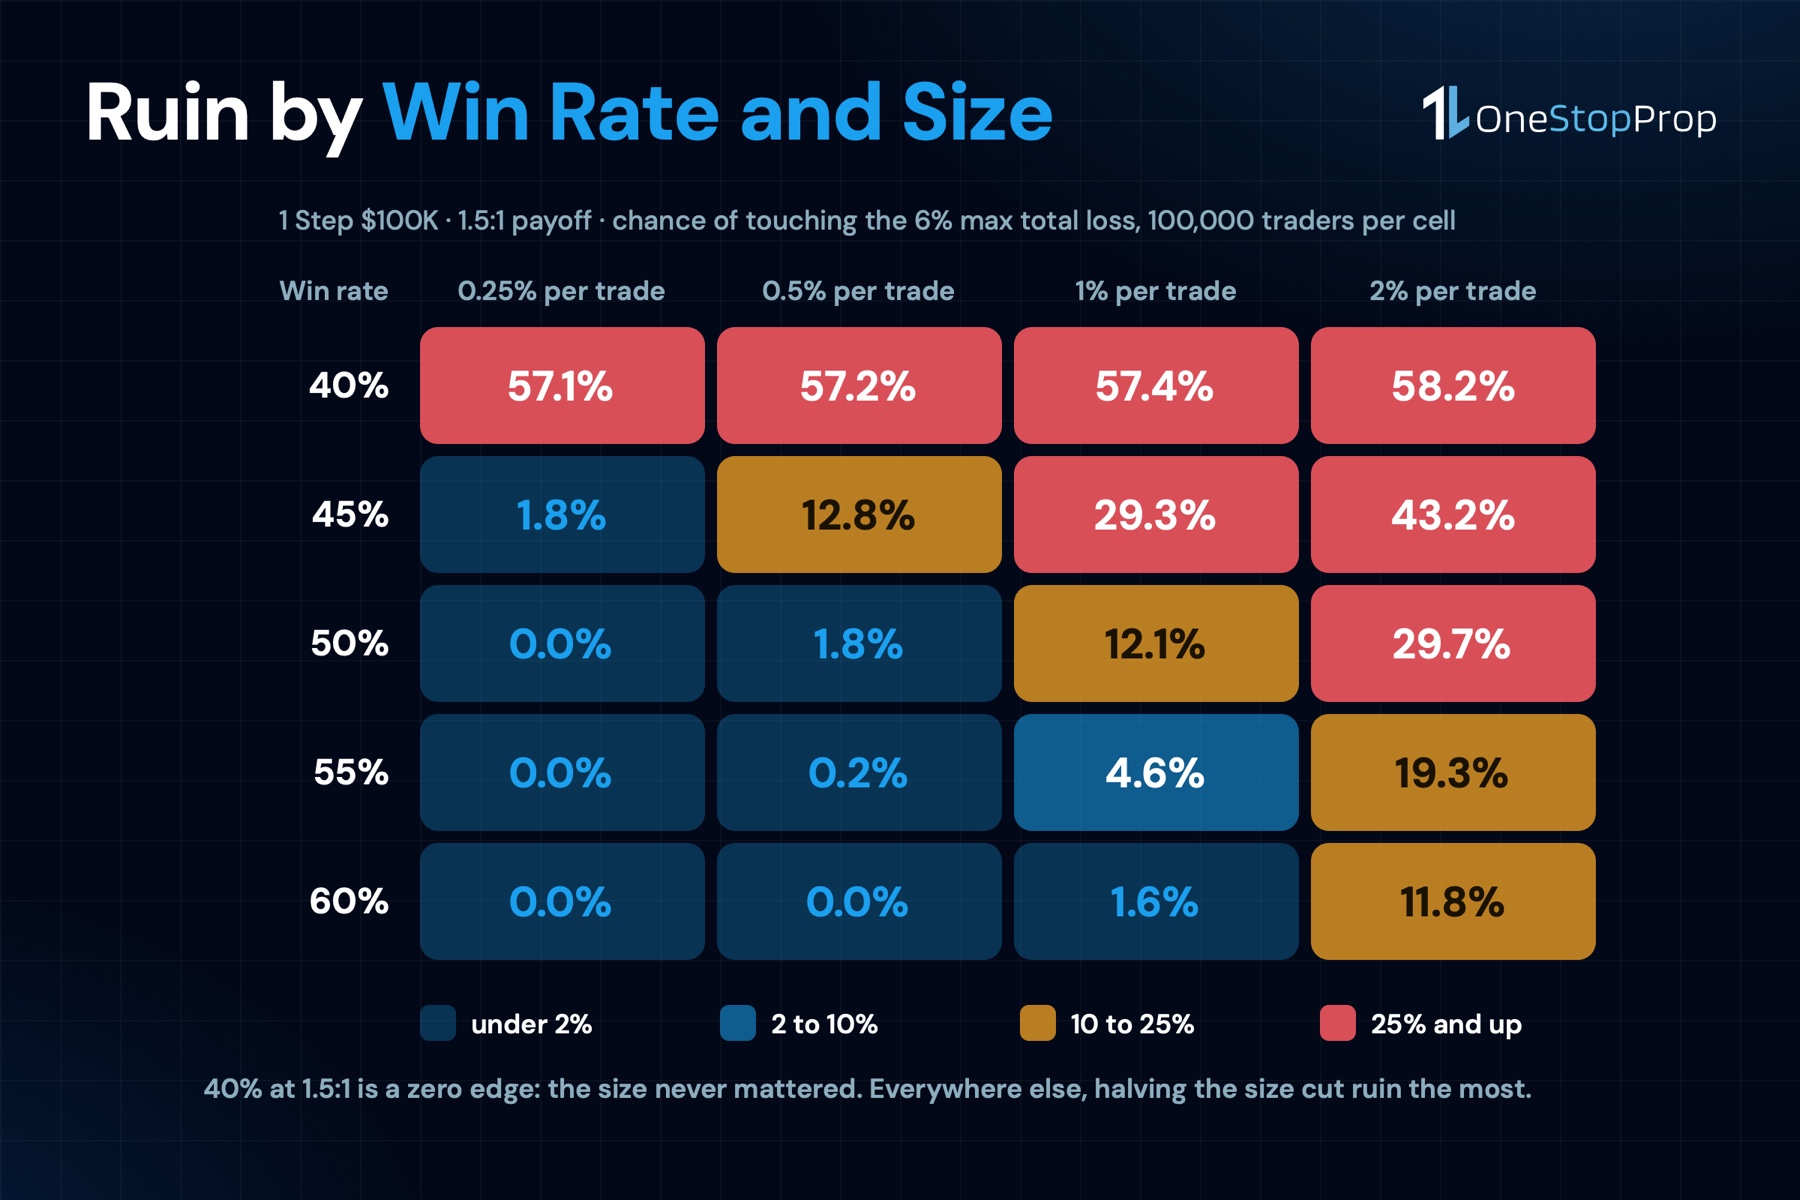
The heat map is the 1.5:1 payoff on 1 Step across every win rate and risk level. 2 things stand out.
The zero-edge row. 40% at 1.5:1 has an expectancy of exactly 0: 0.4 times 1.5 is 0.6, minus 0.6 is 0. In that row, risk per trade made no difference: 57.1%, 57.2%, 57.4%, 58.2%. That is 8 over 14, the fair-game formula. With no edge, size does not change your odds, it only changes how fast you find out.
Everywhere else, the risk column dominates. At 50% and 1.5:1, ruin was under 0.1% at 0.25% risk, 1.8% at 0.5%, 12.1% at 1% and 29.7% at 2%. Going from 55% to 60% at 1% risk took ruin from 4.6% to 1.6%; going from 1% to 0.5% at 55% took it from 4.6% to 0.2%. Across the grid, halving the size did about as much as 5 points of win rate, and usually more.
The routes side by side
Same trader, 50% win rate, 1.5:1 payoff, on each route.
| Risk per trade | 1 Step (6% line) | 2 Step phase 1 (8% line) | 2 Step, both phases | Instant (5% line) |
|---|---|---|---|---|
| 0.25% | 0.0% | 0.0% | 0.0% | 0.1% |
| 0.5% | 1.8% | 0.5% | 0.9% | 3.3% |
| 1% | 12.1% | 6.3% | 11.5% | 16.3% |
| 2% | 29.7% | 20.5% | 34.4% | n/a |
2 Step’s 8% line gives the most room per phase, but phase 2 is a second game on the same line, so ruin across both phases lands close to 1 Step’s. Instant’s 5% line makes it the tightest of the 3 at the same risk per trade, and its 2% daily limit adds a second constraint on pace, not on this number: both are the argument for sizing an Instant account smaller than a challenge.
The Instant cell at 2% is left out: at that size the first losing trade of the day lands on the 2% daily limit, which is a breach, so the question there is not the chance of ruin but how many trades until the first loss. It is a setting no Instant trader should run.
What the daily limit did and did not do
The simulated traders stopped for the day when the next loss would land on the daily limit. At the aggressive settings that happened constantly: 85% of the 50% win rate, 1.5:1 traders on 1 Step at 2% risk hit that stop at least once, and 92% of the same traders on Instant at 1%.
Pausing until tomorrow cannot change their chance of ruin: with the same edge and size, the next trade is the same trade whether it happens today or tomorrow, and the simulation reflects that by construction. Breaching the daily line is a different matter, because it ends the account. The stop is what keeps the daily line from becoming the ruin line; after that, the max total loss decides whether the account survives, and the lever on it is units.
How Many Losses Fit Before Each Line
Each cell is the number of consecutive losses from the starting balance that land exactly on the line, by route and risk per trade, on any account size, because both sides scale together.
| Risk per trade | 1 Step: daily / total | 2 Step: daily / total | Instant: daily / total |
|---|---|---|---|
| 0.25% | 16 / 24 | 16 / 32 | 8 / 20 |
| 0.5% | 8 / 12 | 8 / 16 | 4 / 10 |
| 1% | 4 / 6 | 4 / 8 | 2 / 5 |
| 2% | 2 / 3 | 2 / 4 | 1 / 2.5 |
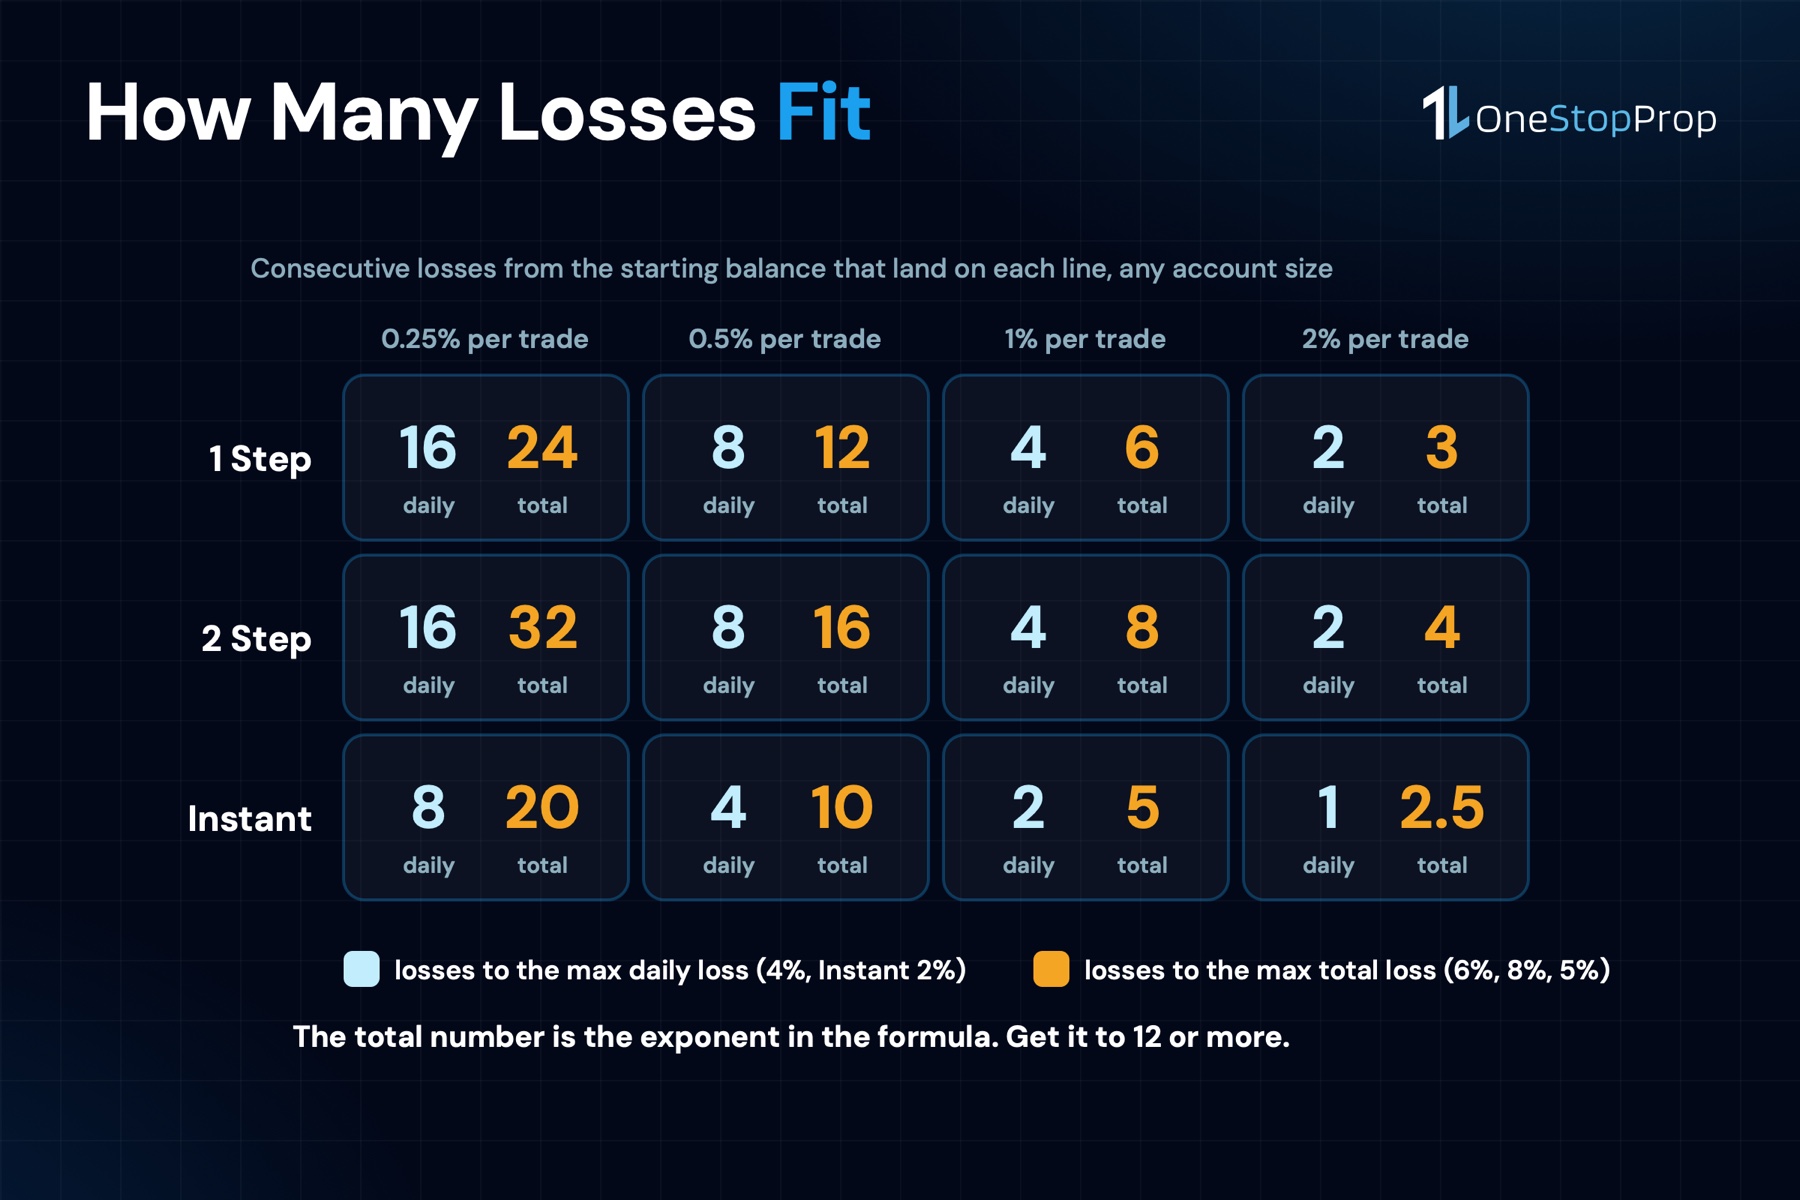
The daily number is a pacing number: at 1% on 1 Step, 3 losses leave $1,000 of daily room and the 4th would land on the line, so a personal stop at 3 losses is what the rule is asking for. The total number is the exponent in the formula, and it shows why 2% risk is so expensive: 3 units on 1 Step, 2.5 on Instant, where the 3rd loss goes through the line rather than onto it. The prop firm drawdown rules guide has the same lines from the rulebook side.
Pro Tip: set your personal daily stop 1 loss short of the daily column, and your risk per trade so the total column reads 12 or more. On 1 Step, every simulated setting with 12 units and an expectancy of at least 0.25 units per trade came in under 2% ruin; the thinner edges needed 24 units to get there, and at 24 every positive edge did.
How to Use It Before the First Trade
1. Get the win rate and payoff from your own records. 50 trades minimum, logged in a trading journal template. The math only means something if the inputs are yours.
2. Compute the expectancy. Win rate times payoff, minus loss rate. If it is 0 or negative, stop: the zero-edge row says size will not save it.
3. Divide the max total loss by the risk per trade. 6% on 1 Step, 8% on 2 Step, 5% on Instant. That is your units.
4. Pick the risk that puts units at 12 or more. On 1 Step that is 0.5% or less; on 2 Step, about 0.67%; on Instant, about 0.4%. Then check the daily column so a bad day stays inside it with 1 loss to spare.
5. Write it in the plan. The trading plan template has a page for position sizing: the risk per trade and the daily stop, in dollars.
6. Re-run it when the lines move. The 12% Max Total Loss + 6% Max Daily Loss Add-On sets the total line at 12%, and at 1% risk that is 12 units instead of 6: the edge from example 1 goes from 13% ruin to under 2%.
Common Mistakes
Using the account balance as the capital
The formula wants the distance to the line, not the balance. $100,000 at 1% risk is 100 units on a personal account and 6 on a 1 Step account. The first number says ruin is near zero at almost any edge. The second says 13% at a 45% win rate and 2:1.
Forgetting that the consistency rule needs a long run too
Ruin is one way to miss the payout. The prop firm consistency rule is the other: no single day can be 25% or more of the cycle’s profit on 1 Step and 2 Step, 20% on Instant. Both rules reward a long sequence of small, similar trades, which is what a low chance of ruin looks like from the inside.
Frequently Asked Questions
What is risk of ruin in trading?
The probability that a sequence of losses takes your capital below the level at which you can keep trading, before your strategy’s edge has time to show. It depends on the win rate, the payoff ratio and how many losses fit between you and that level. On a funded account the level is the max total loss, so few losses fit.
What is the formula?
The classic version, from the gambler’s ruin problem, is ((1 minus edge) divided by (1 plus edge)) raised to the number of units, where edge is win rate minus loss rate and units is capital divided by risk per trade. With a payoff ratio, the base changes to a number solved from the win rate and payoff, and the exponent stays the units.
What risk per trade keeps it low?
On 1 Step in the simulation, every setting with 12 or more units and an expectancy of at least 0.25 units per trade came in under 2%, and at 24 units every positive edge did. That is 0.5% and 0.25% risk per trade. At 2% risk, no win rate tested kept 1 Step ruin under 9%.
Does the daily loss limit change the risk of ruin?
Obeying it keeps the account alive, because breaching the daily line ends the account. Pausing until tomorrow does not change the odds of the sequence, because the pause does not change the edge or the size; it changes how many days the sequence takes. The total loss and the units decide ruin.
Why does the formula give a different number from the simulation?
The classic formula assumes no finish line. A profit target ends some sequences before they could have hit the loss line, so the simulated number comes out a little lower: 13.2% from the formula against 12.4% in the simulation for example 1.
The Bottom Line
Risk of ruin on a funded account is the same gambler’s ruin problem the textbooks solve, with one change: the capital is the distance to the max total loss, not the balance. 6% on 1 Step, 8% on 2 Step, 5% on Instant. Divide that by the risk per trade and you have the exponent, and in 100,000 simulated traders per setting the exponent moved the odds more than the win rate did.
The practical version fits on an index card. Know your edge from your own records. Divide the total loss by the risk per trade and get that number to 12 or more. Stop the day 1 loss short of the daily line.
If you want to run that arithmetic against lines that are written down before the first trade, start a funded account at OneStopProp: 1 Step and 2 Step from $10K to $300K, Instant from $25K to $200K, with no time limit on the challenge and positions held overnight and over the weekend.
Sources
- Introduction to Probability, Section 12.2, Gambler’s Ruin, Dartmouth College (Grinstead and Snell, American Mathematical Society). The ruin probability for a biased random walk against an unlimited opponent, (q/p) to the z, and the finite version with a target. https://math.dartmouth.edu/~prob/prob/prob.pdf
- Risk, Investor.gov (U.S. Securities and Exchange Commission). The definition of risk as uncertainty about returns and the harm when returns miss expectations. https://www.investor.gov/introduction-investing/investing-basics/glossary/risk
- Day Trading, Investor.gov (U.S. Securities and Exchange Commission). The SEC’s warning that day trading is extremely risky and can produce substantial losses in a very short period. https://www.investor.gov/introduction-investing/investing-basics/glossary/day-trading
- What is the Maximum Daily Loss?, OneStopProp Help Center. 4% of the initial balance on 1 Step and 2 Step, 2% on Instant, measured at 12:00 AM EST from the higher of balance or equity. https://help.onestopprop.com/faq/what-is-the-maximum-daily-loss/
- How does max total loss work?, OneStopProp Help Center. 6% on 1 Step, 8% on 2 Step, 5% on Instant, static from the initial balance, with the $100,000 2 Step example at $92,000. https://help.onestopprop.com/faq/how-does-max-total-loss-work-on-standard-accounts/
- When is the daily max limit reset time?, OneStopProp Help Center. The daily limit resets at 12:00 AM EST. https://help.onestopprop.com/faq/when-is-the-daily-max-limit-reset-time/
- Payout Information and Guidelines, OneStopProp Help Center. The 6% buffer on Instant accounts and the 4% buffer on 1 Step and 2 Step before profits can be withdrawn, and the consistency rule by route. https://help.onestopprop.com/faq/payout-rules/