
Most trading journals die in week 3. Not because traders lack discipline, but because the journal was built to record what happened instead of to answer a question.
On a funded account there are specific questions worth answering, and they are not the ones a generic journal asks. Whether your worst day is about to hold up your payout. Whether your stop distance matches the stock you are trading. Whether the rule you broke was a rule or a habit.
This is a trading journal template built around those, with the columns that earn their place and the ones that do not.
Key Takeaways
- A journal for a funded account tracks rules, not just trades. The columns that matter most are the ones tied to the daily loss limit, the consistency rule and the payout cycle, because those are what end accounts and delay money.
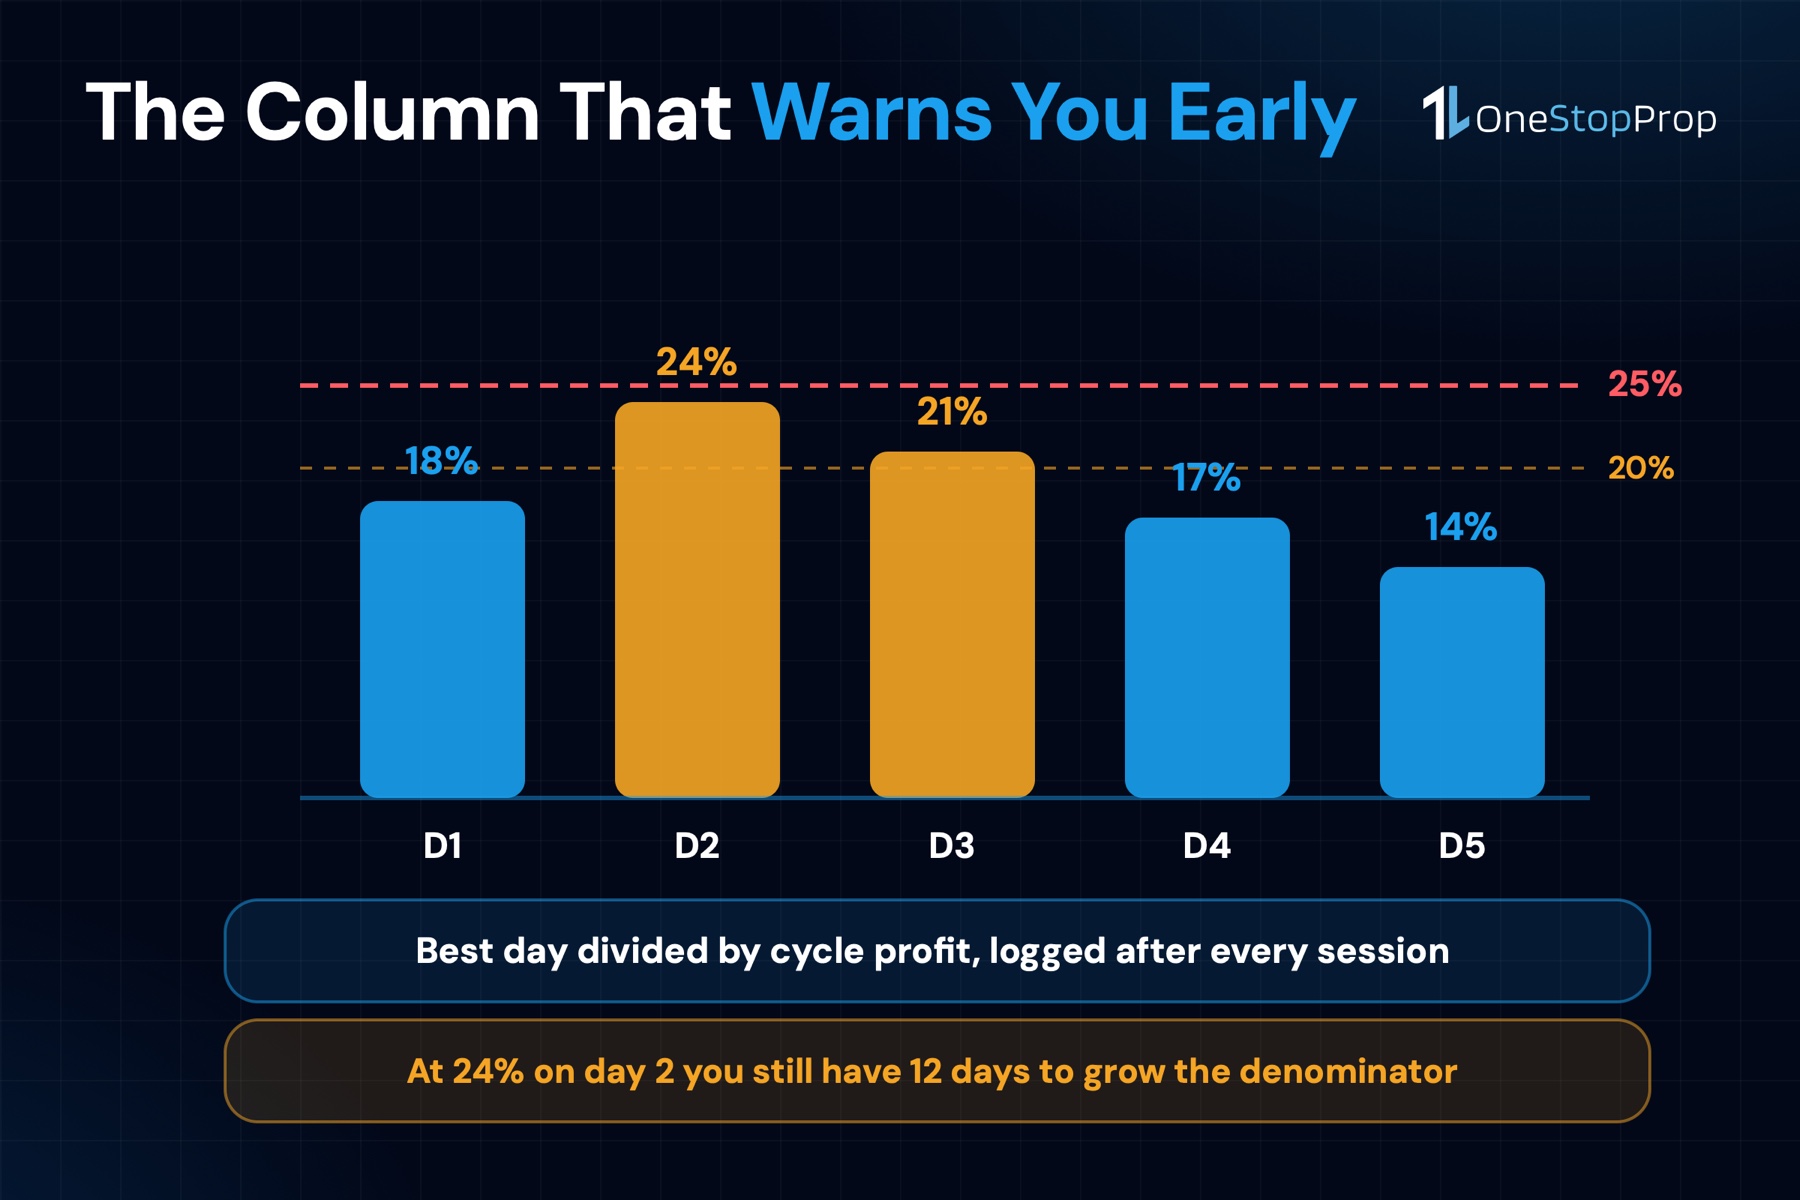
- Log the running consistency ratio after every session. Divide your best day by total cycle profit. If it is climbing toward 25% on 1 Step or 2 Step, or 20% on Instant, you know before the payout request rather than after.
- Record the planned risk and the actual risk separately. The gap between them is the single most useful number in the journal, and it is invisible if you only log entries and exits.
- 14 columns is enough. Anything that takes more than 60 seconds per trade gets abandoned, and an abandoned journal teaches nothing.
- Review weekly, not daily. A single session is noise. The patterns that change behaviour show up across 20 trades, which on most strategies is 2 to 3 weeks.
Why Generic Journal Templates Fail Funded Traders
A standard trading journal template tracks entry, exit, profit and a note about how you felt. That is a diary of outcomes, and outcomes are the least actionable thing in trading, because they are mostly noise in the short run.
A funded account adds constraints a personal account does not have, and none of them appear in a generic template.
The daily loss limit means a sequence of ordinary losses can end the account in a single session, so the journal has to make position sizing visible, not just results. The consistency rule means a great day creates a problem later, so the journal has to track the shape of your profits, not only the total. The payout cycle means days traded is a number you have to hit, so the journal has to count it.
A journal that does not track those 3 is not tracking what actually decides whether you get paid.
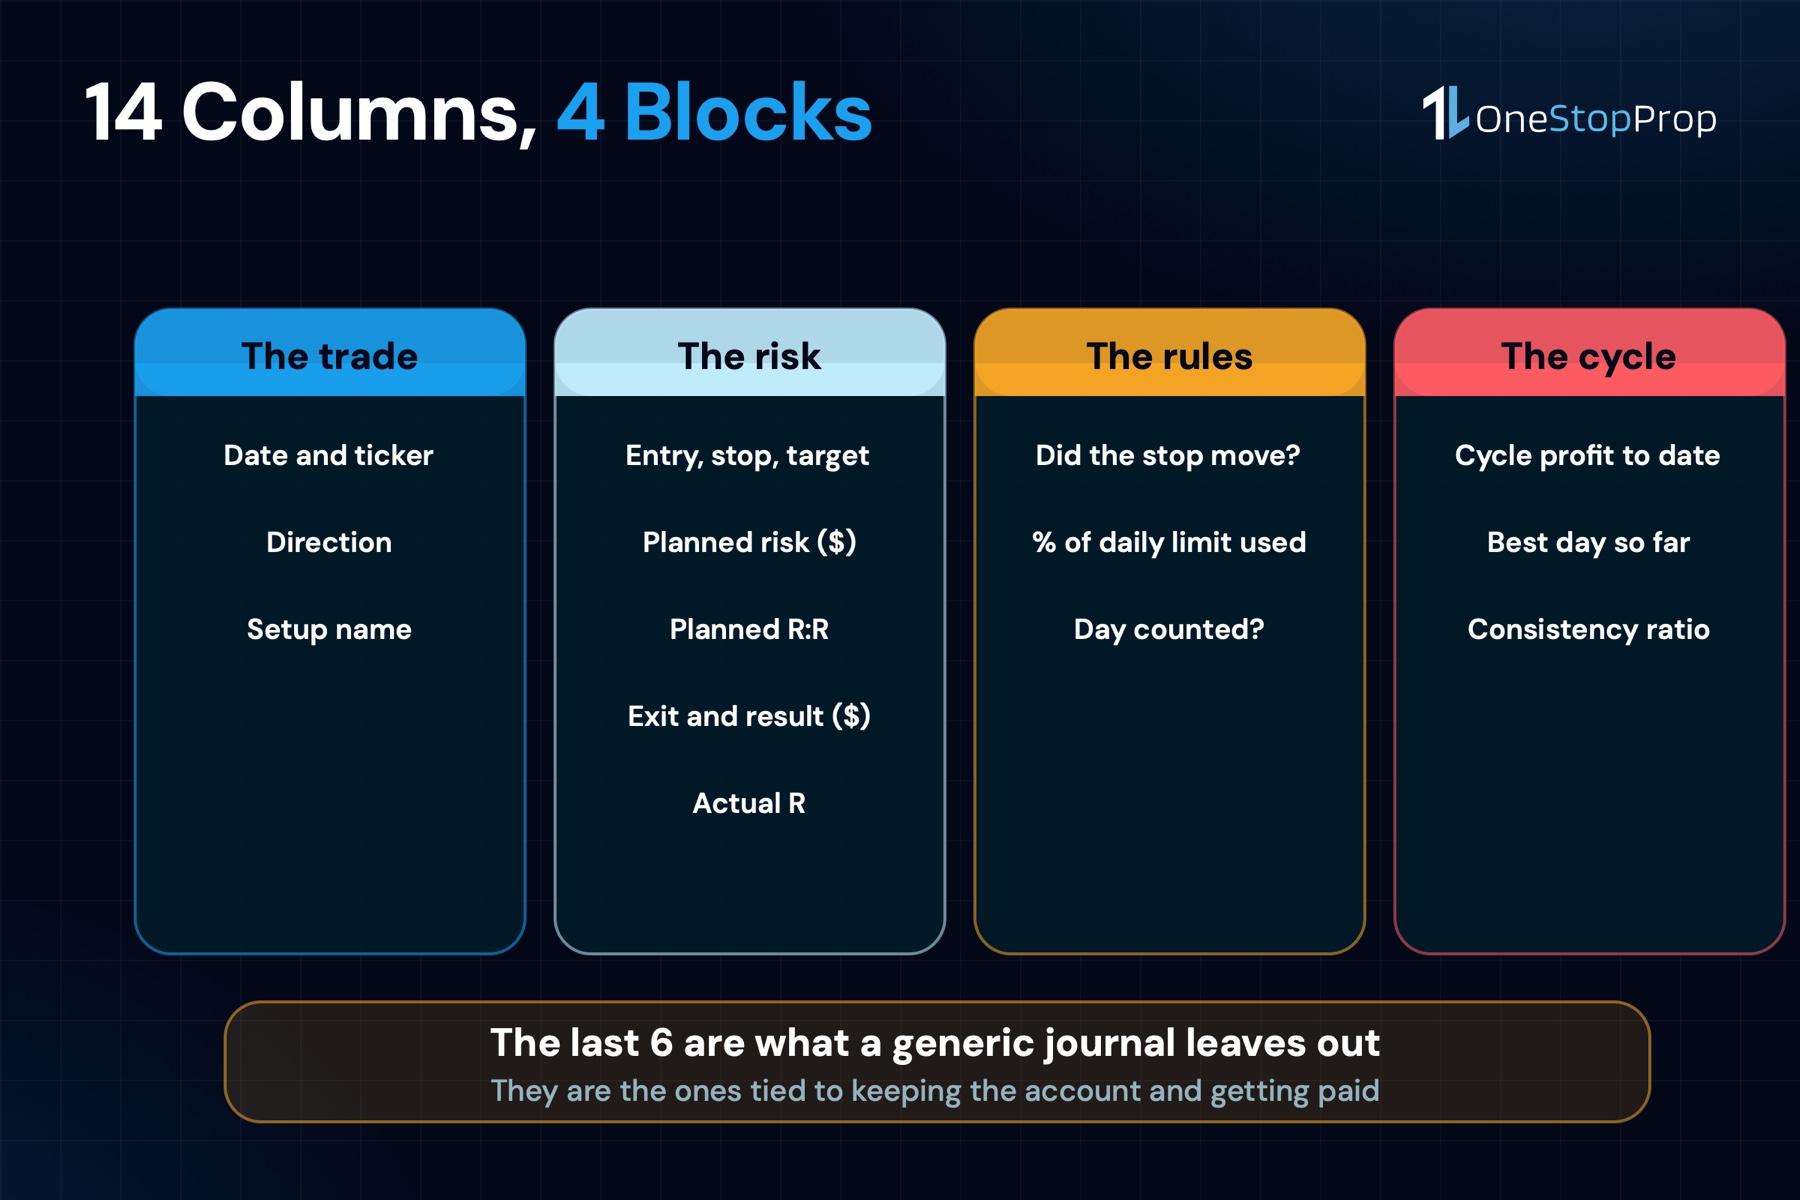
The 14 Columns That Earn Their Place
Build it in a spreadsheet. One row per trade, one tab per payout cycle.
The trade itself
- Date and ticker. Obvious, but the ticker matters more than it looks: it is how you later discover that most of your losses come from 2 names.
- Direction. Long or short.
- Setup name. Use the same 4 or 5 labels every time. “Opening range breakout”, “VWAP reclaim”, “earnings fade”. If you cannot name the setup, that is itself the finding.
The risk, planned and actual
- Entry, stop, target. The 3 prices, written before the trade opens.
- Planned risk in dollars. Position size multiplied by the distance to the stop.
- Planned R:R. Distance to target divided by distance to stop. If it is below your minimum, the trade should not exist.
- Actual exit and actual result in dollars.
- Actual R. Result divided by planned risk. A trade that made 1.4 times what you risked is a 1.4R, and this is the column that makes different position sizes comparable.
The rules
- Did the stop move? Yes or no. Nothing else. This one column catches the most expensive habit in funded trading.
- Percentage of the daily limit used. Running total for the session, as a percentage of your 4% on 1 Step and 2 Step, or 2% on Instant.
- Trading day counted? Yes or no, for the payout cycle minimum of 6 days on 1 Step and 2 Step or 8 on Instant.
The cycle
- Cycle profit to date. Running total since the cycle started.
- Best day so far. The largest single-day profit in this cycle.
- Consistency ratio. Column 13 divided by column 12. This is the early warning for a delayed payout.
That is the whole template. Columns 9 through 14 are the ones a generic journal does not have, and they are the ones that matter on a funded account.
The 3 Numbers to Read Every Week
A journal with 14 columns produces more data than anyone acts on. 3 numbers carry almost all the signal.
Planned risk against actual risk. Add up column 5 and compare it to the sum of losses that exceeded it. If actual losses regularly run larger than planned, you are not a trader with bad luck, you are a trader whose stops move. Column 9 tells you which trades.
Average R by setup. Group column 8 by column 3. Most traders find that one setup carries the account and another quietly bleeds it. The fix is not better execution on the losing setup, it is fewer of them.
The consistency ratio trend. If column 14 is above 22% on a 25% rule, every trade for the rest of the cycle has a second job: growing the denominator. That changes how you size, and knowing it on day 4 of a cycle is worth more than knowing it on day 13.
Pro Tip: put columns 10 and 14 at the far left of the sheet, where you see them without scrolling. The 2 numbers that decide whether you keep the account and whether you get paid on time should not be the ones you have to go looking for.
What Not to Track
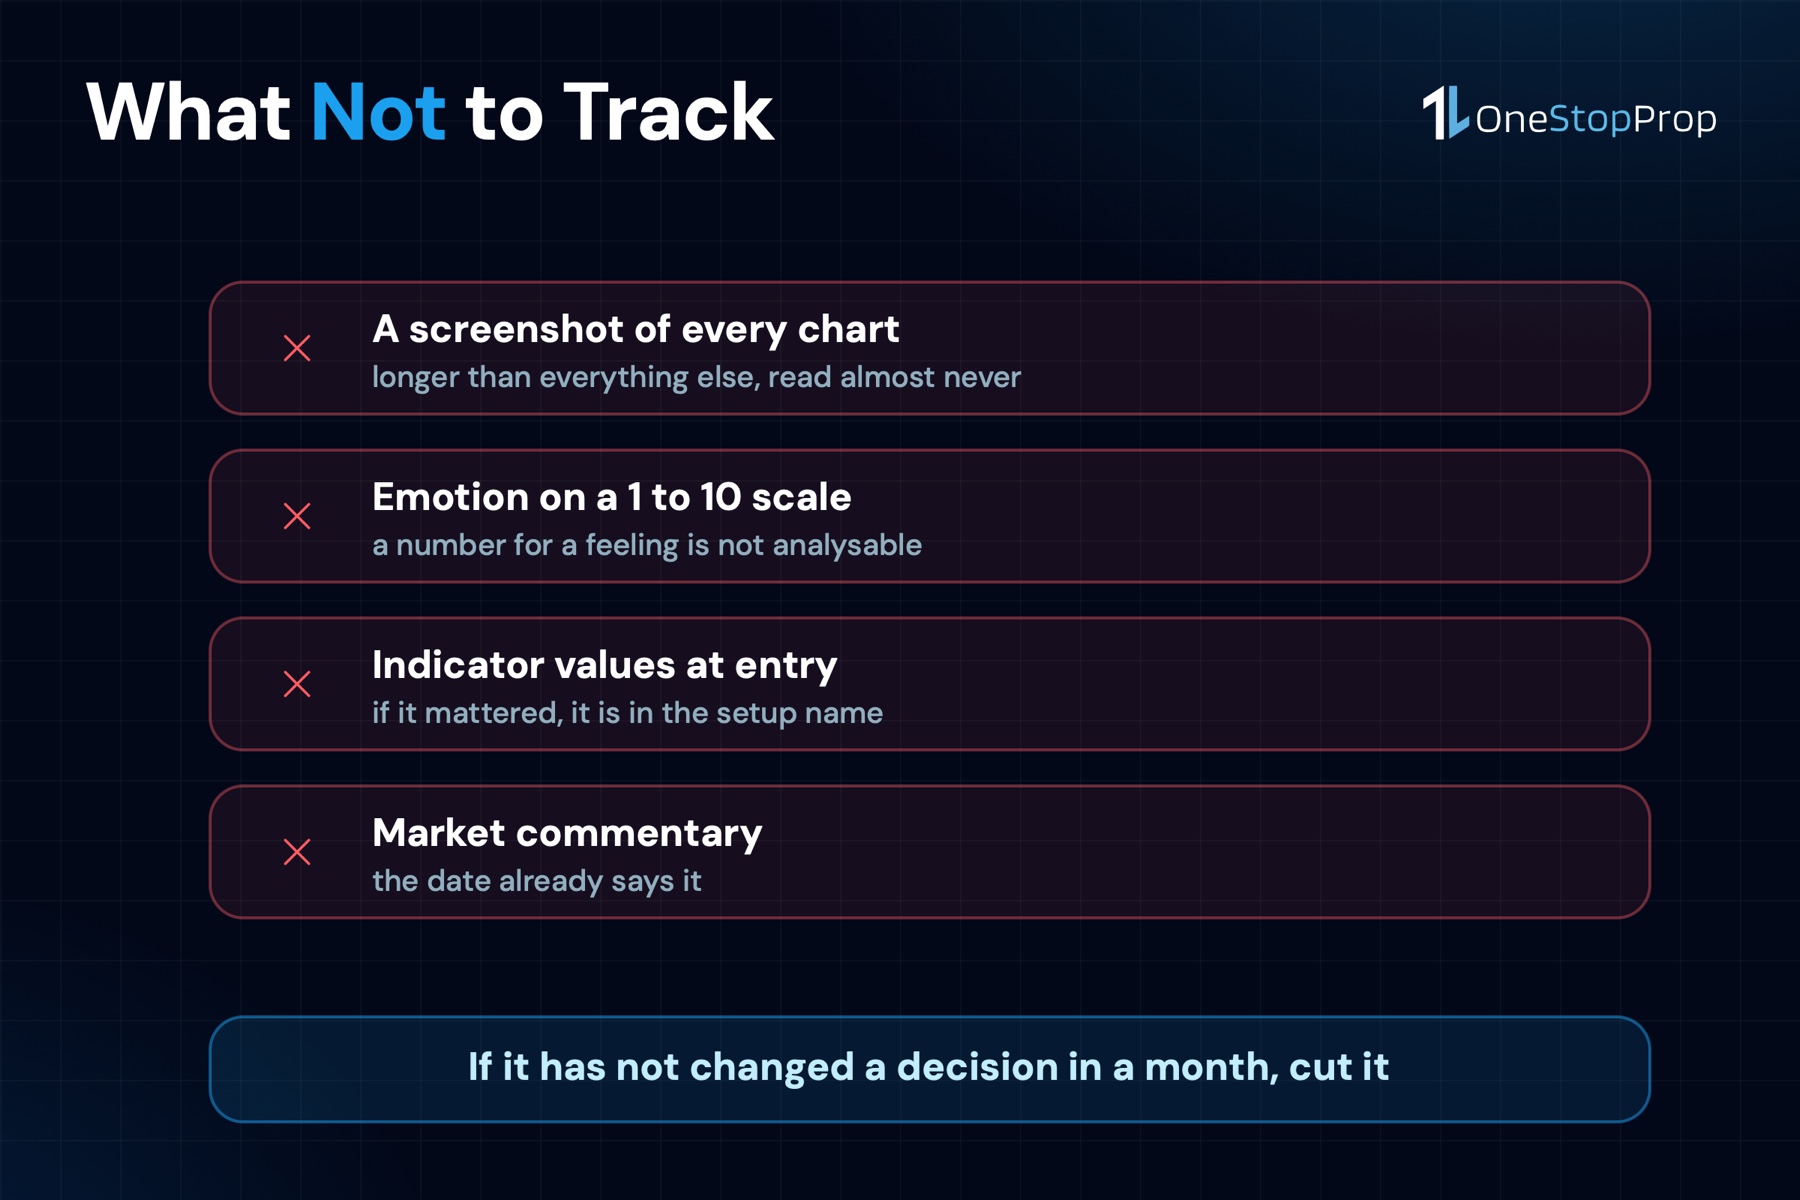
The fastest way to kill a journal is to make it a chore, and most templates do that by asking for things that never get read.
Screenshots of every chart. They take longer than everything else combined and get reviewed almost never. Take them for the trades that surprised you, which is maybe 1 in 10.
Emotion ratings on a 1 to 10 scale. A number for how you felt is not analysable. A 5-word note on trades that went wrong is.
Indicator values at entry. If RSI mattered to the decision it belongs in the setup name. Recording 6 indicator readings per trade produces a dataset nobody queries.
Market commentary. Whether the Fed spoke that morning is already in the date.
Cut anything you have not used to change a decision in the last month.
Building It in a Spreadsheet
Set up one tab per payout cycle rather than one long sheet. The cycle is the unit that matters, because the consistency rule and the day count both reset with it.
4 formulas do the work:
- Actual R:
=result / planned_risk - Percentage of daily limit:
=SUMIF(date_column, today, result_column) / daily_limit - Cycle profit:
=SUM(result_column) - Consistency ratio:
=MAX(daily_totals) / cycle_profit
Build a small daily totals column off to the side, summing results by date. The consistency ratio needs it, and it is also the fastest way to spot the day that is about to become a problem.
Conditional formatting on 2 cells is worth the 2 minutes: the daily limit percentage turns amber at 50% and red at 75%, and the consistency ratio turns amber at 20% on a 25% rule.
Adapting the Trading Journal Template to Your Route
The columns stay the same across routes. The thresholds you measure against do not, and a trading journal template that hardcodes the wrong number is worse than no template at all.
On 1 Step and 2 Step, column 10 measures against a 4% daily loss limit, column 11 counts toward 6 trading days per payout cycle, and column 14 has to stay under 25%.
On Instant, the daily loss limit is 2%, the cycle needs 8 trading days, and the consistency ratio has to stay under 20%. Everything is tighter, so the conditional formatting should trigger earlier: amber at 40% of the daily limit rather than 50%.
With the Zero Profit Buffer Add-On, the consistency threshold drops to 15% on any route. If you buy that Add-On, change the number in your sheet the same day, because a trading journal template still checking 25% will tell you everything is fine while the payout is being held.
Put the thresholds in their own cells at the top of the sheet and have the formulas reference those cells. When a rule changes, you edit one number instead of hunting through formulas.
How to Use the Journal in a Weekly Review
A trading journal template only pays for itself in the review, and the review is 20 minutes, not an afternoon.
Open the cycle tab and read column 14 first. If the consistency ratio is climbing, the week’s job is already decided: more sessions, smaller sizes, grow the denominator.
Group column 8 by column 3. Average R by setup. Any setup below 0 after 20 trades is a setup to stop taking, not a setup to improve.
Count the yes answers in column 9. Every moved stop is a trade where the plan and the execution came apart. If the count is above 1 in 10, the stops are too tight for the stocks being traded, and the fix belongs in the entry rules rather than in willpower.
Look at the 2 largest losses. Not the outcome, the planned risk. If they were sized larger than the rest, the account is being run on conviction instead of a rule, and conviction is what the daily loss limit exists to survive.
Write 1 sentence at the bottom of the tab about what changes next week. That sentence is the only output of the review that matters, and a trading journal template that does not produce it is just a spreadsheet.
Setting It Up Without Abandoning It in Week 3
The failure mode is always the same: the trading journal template starts complete and gets filled in less each week until it stops. 3 things prevent it.
Start with 6 columns, not 14. Date, ticker, planned risk, result, actual R, and did the stop move. That is enough to answer the 2 questions that matter most in the first month: is the sizing consistent, and do the stops hold. Add the cycle columns when you are funded and they start applying.
Fill it in from the platform, not from memory. Match-Trader shows entry, exit and result. Copy them at the close of each session while the trades are still on screen. A trading journal template reconstructed on Sunday from memory is fiction, and fiction averaged over 20 trades is worse than no data.
Put it where the trading happens. A spreadsheet in a folder you have to go looking for gets filled in once a week and then never. Pin the tab next to the platform.
The honest test of whether the template is working is whether you have changed something because of it. If 3 weeks have passed and the trading journal template has not produced a single change to position size, setup selection or stop placement, it is a logbook rather than a tool, and the columns need to be fewer and sharper rather than more.
What the Journal Looks Like After 30 Trades
The first useful read comes at about 30 trades, which on most strategies is 4 to 6 weeks. By then the trading journal template answers questions that were guesses before.
Which setup actually pays. Average R grouped by setup name, with at least 8 trades per setup. Most traders find the spread between their best and worst setup is wider than they expected, and that the worst one is the one they trade most often.
Whether the stops are sized for the stocks. If the stop moved on more than 1 trade in 10, the stops are too tight for the daily range of what you are trading, and the entries need to move rather than the discipline.
How close the account really gets to the daily limit. The maximum value column 10 reached across all sessions. If it has touched 60% even once, the position size is larger than the rules can carry, regardless of how the trades turned out.
Whether the cycle shape is a problem. The highest consistency ratio across completed cycles. A trading journal template that shows 30% in 2 of the last 3 cycles is telling you the payouts will keep being late until the sizing flattens out.
Common Mistakes With a Trading Journal
Logging After the Session Instead of Before the Trade
Columns 4 through 6 are predictions, and their value comes from being written before the outcome is known. Filling them in afterwards turns the journal into a record of what you wish you had planned.
Keeping It for the Evaluation and Dropping It Once Funded
The rules get harder after funding, not easier. The consistency rule and the payout cycle only exist on the funded side, so dropping the journal at exactly the point it becomes most useful is backwards.
Tracking Profit Instead of R
Dollar results across different position sizes cannot be compared. A $400 win on a $4,000 risk is worse than a $150 win on a $300 risk, and only column 8 shows that.
Reviewing Only the Losses
The losing trades are where traders look, and the winners are where the dangerous habit hides: an oversized position that happened to work is still an oversized position. Column 5 against column 10 catches it.
Frequently Asked Questions
What should a trading journal template include for a prop firm account?
Everything a normal journal has, plus 3 things a funded account needs: the percentage of the daily loss limit used each session, whether the day counts toward the payout cycle minimum, and the running consistency ratio of your best day against total cycle profit. Those 3 track the rules that end accounts and delay payouts.
How often should I update my trading journal?
The trade rows go in before and immediately after each trade, and the cycle columns update at the close of each session. The review is weekly. Daily reviews read noise as signal, and most strategies need around 20 trades before a pattern means anything.
Is a spreadsheet good enough, or do I need journaling software?
A spreadsheet is enough, and it has an advantage: you can add a column the moment a rule changes. Dedicated software is faster to fill in but harder to bend around a specific firm’s rules, and the rules are the reason the journal exists on a funded account.
What is the most important column in a trading journal template?
Actual R, which is the result divided by the planned risk. It is the only column that makes trades of different sizes comparable, and grouping it by setup name is what tells you which setup actually carries the account.
How do I track the consistency rule in my trading journal template?
Keep a daily totals column, then divide the largest single day by the cycle total. On 1 Step and 2 Step accounts that number has to stay under 25%, and on Instant under 20%. Watching it during the cycle gives you time to grow the denominator instead of discovering the problem at the payout request.
Should I journal demo and funded trades together?
Separately. The rules are different, the position sizes are different, and mixing them makes the averages meaningless. One file per account, one tab per payout cycle.
The Bottom Line
A trading journal template is only worth keeping if it answers questions you would otherwise get wrong. On a funded account those questions are about rules: how much of the daily limit you spent, how many days you have traded this cycle, and whether one good session is about to hold up your money.
14 columns, one tab per cycle, 3 numbers read weekly. Anything beyond that is a hobby, and hobbies get dropped in week 3.
If you want to run it against real rules, OneStopProp’s 1 Step and 2 Step routes publish the daily loss limit, the consistency threshold and the cycle minimums upfront, so every column in this template has a number to measure against.
Sources
- Payout Rules, OneStopProp Help Center. Consistency thresholds, minimum trading days per cycle and the profit buffer. https://help.onestopprop.com/faq/payout-rules/
- What is the Maximum Daily Loss?, OneStopProp. The daily loss limit by route, for column 10. https://help.onestopprop.com/faq/what-is-the-maximum-daily-loss/
- Prop Firm Consistency Rule: How It Works, OneStopProp. The rule behind columns 12 to 14, worked in dollars. https://onestopprop.com/prop-firm-consistency-rule/
- Risk Reward Ratio for Stock Traders, OneStopProp. The math behind columns 6 and 8. https://onestopprop.com/risk-reward-ratio-stock-traders/
- Funded Account Trading: How It Works, OneStopProp. The routes and the rules each column measures against. https://onestopprop.com/funded-account-trading/