Candlestick patterns are the first thing most traders learn to see on a chart and the last thing they ever test. A hammer at the bottom of a dip, an engulfing candle at the top of a run: the shapes are easy to spot, the names are easy to remember, and the books all say roughly the same thing about what comes next.
So this guide counted. It took 2 years of daily candles on the stocks of OneStopProp’s instrument list, 142 stocks with complete data and 66,882 sessions, wrote down a numeric definition for 5 patterns, and measured what the next session and the next 5 sessions did after each one, against what every other session did.
Then it does the part a funded trader actually needs: where the stop goes for each pattern, how far away it sits as a share of the price, and what position that leaves inside the daily loss limit of a $100K account.
Key Takeaways
- The edge is small and it lasts 1 day. After a hammer the next session closed higher 53.1% of the time against a base rate of 50.3%. After a shooting star it closed lower 52.1% of the time against 49.7%. 5 sessions later, every pattern was back at the base rate or below it.
- The bullish engulfing candle went the wrong way. On 1,001 cases the next session closed higher only 44.9% of the time, 5.4 points under the base. With volume 1.5 times normal, 33.2%.
- The doji said nothing, 6,662 times. The next session closed up 49.6% of the time.
- The stop is the useful number. The hammer’s stop sits a median 2.01% below the close, the shooting star’s 2.07% above, the engulfing candles’ 2.9% to 3.3% away. A head and shoulders stop on the same list sat 10.5% away.
- $500 of risk buys a $24,876 hammer position. On a $100K 1 Step or 2 Step account the daily loss limit is $4,000, so that is 8 stopped hammers in a day. On Instant, with a $2,000 limit, 4.
What Candlestick Patterns Are
A candlestick, in Nasdaq’s glossary definition, displays an asset’s opening, closing, high and low prices for the period as a box, called the real body, with a vertical line on both the top and bottom. The body is the distance between the open and the close. The lines, the wicks, are how far the price travelled beyond the body and gave back.
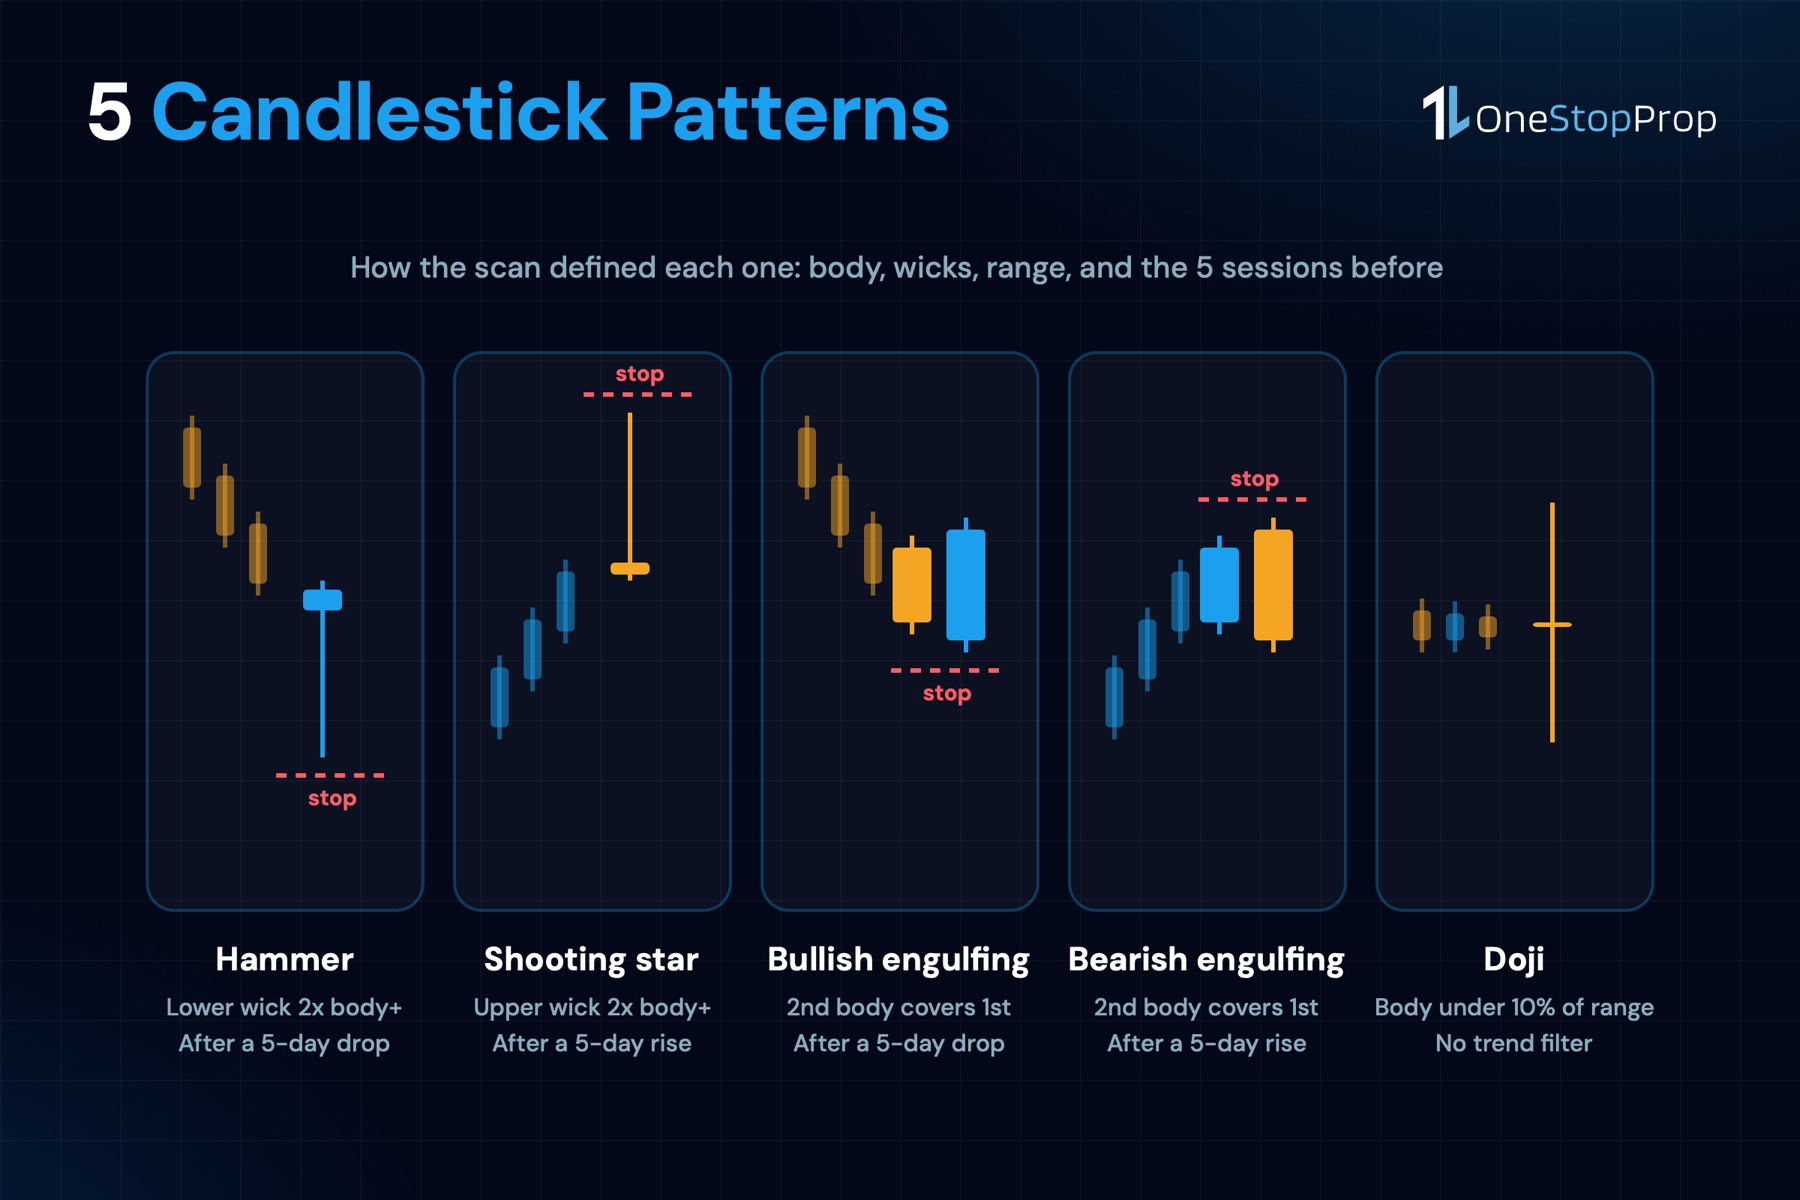
Candlestick patterns are shapes made by 1, 2 or 3 of those boxes that are supposed to say something about the next few sessions. The 5 this guide measured are the ones in every introductory chart book:
- Hammer. A small body at the top of the range, a long lower wick, almost no upper wick, after a decline. Sellers pushed, buyers took it back by the close.
- Shooting star. The mirror image after a rise: a small body at the bottom, a long upper wick.
- Bullish engulfing. 2 candles after a decline: a down candle, then an up candle whose body covers the first one’s body entirely.
- Bearish engulfing. 2 candles after a rise: an up candle, then a down candle that covers it.
- Doji. Open and close at nearly the same price, with wicks on both sides. The textbook label is indecision.
How the Scan Defined Each Pattern
A pattern that cannot be written as a rule cannot be counted, and the count changes with the rule. The results below belong to these rules and no others. For every candle: body is the gap between open and close, range is high minus low, the lower wick runs from the lower of open and close down to the low, the upper wick from the higher of the 2 up to the high.
- Hammer. Body no bigger than a third of the range. Lower wick at least 2 times the body. Upper wick no more than 10% of the range. Range at least 1% of the previous close, so a flat day does not count. Prior trend down: the close of the session before the candle is lower than the close 5 sessions before that.
- Shooting star. The same 4 checks flipped: upper wick at least 2 times the body, lower wick at most 10% of the range, body at most a third, and a prior 5-session rise.
- Bullish engulfing. The first candle closes down with a body of at least 0.2% of its close. The second closes up, opens at or below the first candle’s close, closes at or above the first candle’s open, and has the bigger body. Prior 5-session decline measured before the first candle.
- Bearish engulfing. The mirror: up candle, then a down candle that opens at or above the first close and closes at or below the first open, with the bigger body, after a 5-session rise.
- Doji. Body no more than 10% of the range, range at least 1% of the previous close. No trend filter, because the textbooks do not give one.
The data is the daily open, high, low, close and volume of the stocks on OneStopProp’s instrument list, from Nasdaq’s historical quotes, 2 years to November 3, 2026. 142 stocks had 2 full years with volume. Patterns were counted from December 10, 2024 to October 27, 2026, leaving 20 sessions at the start for the volume average and 5 at the end to see what happened.
For each pattern the scan recorded the close 1 and 5 sessions later, the extremes of those 5 sessions, and the candle’s volume against the previous 20. The base rate is the same measurement on all 66,882 sessions: the next session closed higher 50.3% of the time, and 5 sessions later 51.3%.
What 5 Candlestick Patterns Did the Next Session
Success here means the next close went the way the pattern says: up after a hammer or a bullish engulfing, down after a shooting star or a bearish engulfing. For the doji, which has no direction, the table shows the share that closed up.
| Pattern | Cases | Next session went the pattern’s way | Base rate | Median next move | 5 sessions, pattern’s way | Base rate at 5 |
|---|---|---|---|---|---|---|
| Hammer | 798 | 53.1% | 50.3% | +0.12% | 48.9% | 51.3% |
| Shooting star | 885 | 52.1% | 49.7% | 0.10% down | 48.8% | 48.7% |
| Bullish engulfing | 1,001 | 44.9% | 50.3% | 0.22% down | 48.0% | 51.3% |
| Bearish engulfing | 1,034 | 51.1% | 49.7% | 0.01% down | 48.9% | 48.7% |
| Doji | 6,662 | 49.6% closed up | 50.3% | 0.00% | 50.6% up | 51.3% |
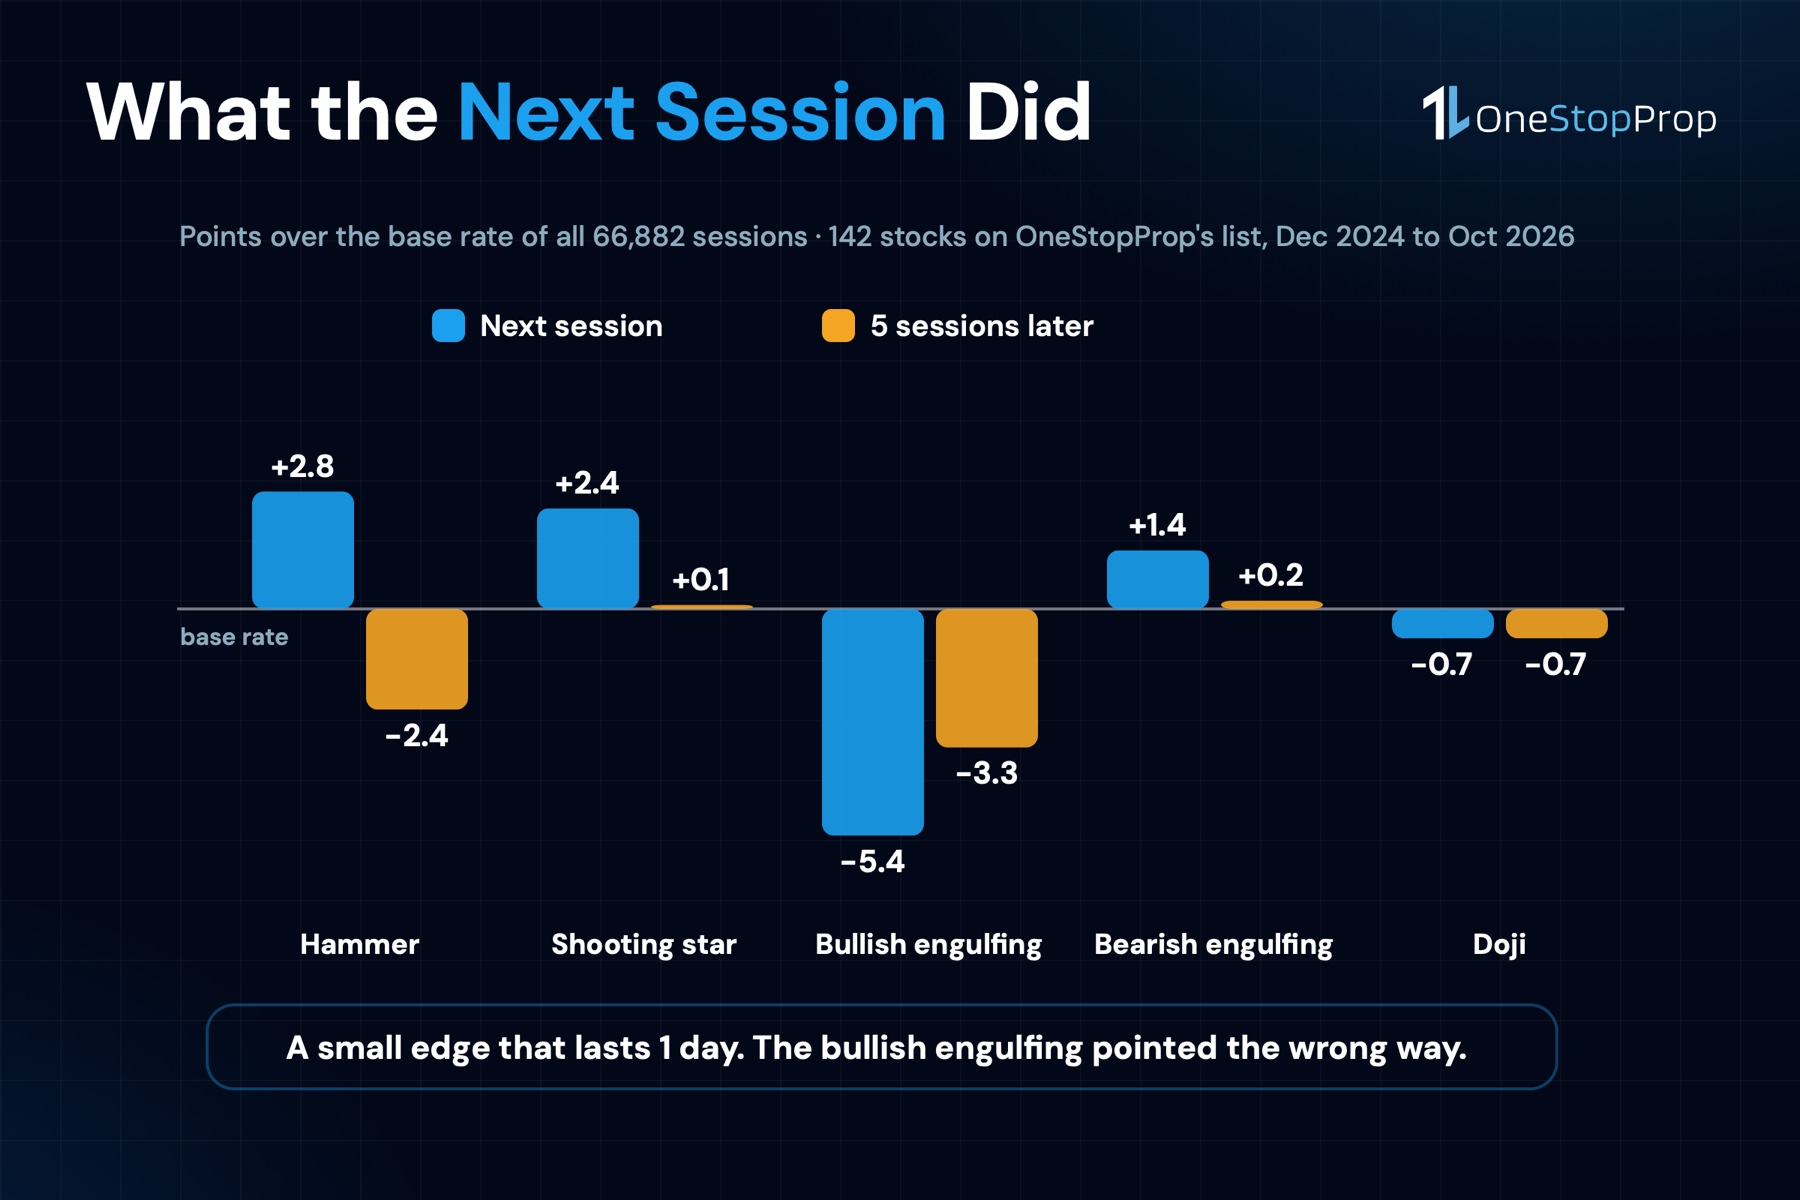
4 things to read out of that table.
The single-candle reversals worked a little, for a day. The hammer added 2.8 points to the odds of an up close the next session and the shooting star added 2.4 points to the odds of a down close. Real on 798 and 885 cases, and small: the median next-day move after a hammer was 0.12%. By the fifth session both had given it back.
The bullish engulfing candle was a fade. 1,001 times a stock fell for a week, then printed a big up candle that swallowed the previous down one, and the next day it closed lower 55.1% of the time. On daily charts of large U.S. stocks, a large up day after a decline was more often the end of a bounce than the start of one.
The bearish engulfing candle did almost nothing. 51.1% against a 49.7% base the next day, 48.9% against 48.7% at 5 sessions. Noise.
The doji is 1 session in 10, and it means a coin. 6,662 cases, 49.6% up the next day, 50.6% up 5 sessions later, and the same after a 5-session decline or rise. Bulkowski’s page on the long legged doji says the breakout direction after a doji is random, and this data says the same about the next close.
Pro Tip: on a funded account, treat every candlestick pattern as a stop location first and a forecast second. The hammer’s low, the shooting star’s high and the outer edge of an engulfing pair are the one price where the pattern is wrong, and that price is known at the close. Divide your risk per trade by the distance to it before anything else.
Volume Did Not Rescue the Patterns
Every candlestick book says a pattern on heavy volume is a better pattern. This scan split each one by the relative volume of the pattern candle, its volume against the average of the previous 20 sessions, at 1.5 and above against below 1.5. The relative volume guide explains the ratio.
| Pattern | Volume 1.5x or more | Next session, pattern’s way | 5 sessions | Volume below 1.5x | Next session | 5 sessions |
|---|---|---|---|---|---|---|
| Hammer | 104 | 51.0% | 47.1% | 694 | 53.5% | 49.1% |
| Shooting star | 90 | 55.6% | 60.0% | 795 | 51.7% | 47.5% |
| Bullish engulfing | 190 | 33.2% | 34.7% | 811 | 47.6% | 51.0% |
| Bearish engulfing | 103 | 47.6% | 51.5% | 931 | 51.5% | 48.7% |
| Doji | 523 | 47.2% closed up | 6,139 | 49.8% closed up |
The heavy-volume hammer was slightly worse than the quiet one. The heavy-volume bullish engulfing was much worse: 190 cases, and the next session closed higher 1 time in 3. A big up candle on 1.5 times normal volume after a decline, on this list and in these 2 years, was a day that got sold the next morning.
The one place volume helped was the shooting star: 90 cases on heavy volume, down the next day 55.6% of the time and down 5 sessions later 60.0%. A small sample, and the only cell worth a second look with more data.
Bulkowski’s Numbers, and Why They Differ
Thomas Bulkowski tested the same shapes on a far larger sample and publishes the results pattern by pattern. His hammer acts as a bullish reversal 60% of the time, which he calls “not far from random.” His shooting star reverses 59% of the time, near random in his words. His bullish engulfing reverses 63% of the time but ranks 84th of 103 candles for what happens afterward. His bearish engulfing reverses 79% of the time and ranks 91st for the trend that follows, which he describes as short-lived.
2 things explain the gap between his 60% and this scan’s 53%. The first is the definition of success: Bulkowski counts a reversal when price closes beyond the pattern’s top or bottom, whenever that happens, while this scan asks what the very next close did, and then the fifth.
The second is the sample: his spans decades and both bull and bear markets, this one is 2 years of 142 large U.S. stocks, most of it in a rising market, which is why every bearish pattern here faces a base rate below 50%. Where the 2 agree is the part worth keeping: a few points better than a coin, no lasting move, and a doji that leads nowhere.
Where the Stop Goes, and What It Costs
This is where candlestick patterns earn a place on a funded account, and the reason is not the forecast.
Each of the 4 directional patterns hands you a stop price at the close. For the hammer it is the candle’s low: if price trades below it, the buyers who supposedly took control did not. For the shooting star it is the high. For a bullish engulfing it is the lower of the 2 lows, for a bearish engulfing the higher of the 2 highs.
The scan measured that distance as a share of the pattern close, then followed 5 sessions to see which came first: the stop, or a move of the same size in the pattern’s direction, which is 1R.
| Pattern | Stop | Median distance to the stop | $500 of risk buys | $1,000 of risk buys | Stop hit first | 1R reached first |
|---|---|---|---|---|---|---|
| Hammer | below the candle’s low | 2.01% | $24,876 | $49,751 | 44.7% | 48.4% |
| Shooting star | above the candle’s high | 2.07% | $24,155 | $48,309 | 46.2% | 47.1% |
| Bullish engulfing | below the lower of the 2 lows | 3.32% | $15,060 | $30,120 | 35.5% | 38.1% |
| Bearish engulfing | above the higher of the 2 highs | 2.92% | $17,123 | $34,247 | 41.4% | 39.7% |
The position column is the arithmetic: $500 divided by 2.01% is a $24,876 position, whatever the share price. On the head and shoulders pattern the median stop was 10.5% away and $500 bought under $5,000 of stock. On a bull flag pattern it was the flag’s low, several percent away. A hammer’s stop is 1 day’s lower wick, and that is why these patterns, with their thin forecast, fit a funded account better than the big ones do.
The daily loss limit on a $100K 1 Step or 2 Step account is 4% of the initial balance, $4,000, measured at 12:00 AM EST from the higher of balance or equity, per the Help Center’s maximum daily loss page. On Instant it is 2%, $2,000. At $500 a stop that is 8 failed hammers in a day on the first 2 routes and 4 on Instant; at $1,000 it is 4 and 2. Nobody takes 8 hammers in a day, which is the point: the stop is small enough that the account survives a bad run of them.
The last 2 columns are the honest part. Over 5 sessions the hammer reached 1R before the stop 48.4% of the time and hit the stop first 44.7% of the time. The engulfing patterns, with wider stops, resolved less often inside 5 sessions and split about evenly when they did. A 48% rate at 1R needs the winners to run further than the losers to be worth taking at all.
2 Real Hammers: NVDA and PLTR
Every price from the daily data. Both candles pass all 5 checks in the hammer definition above.
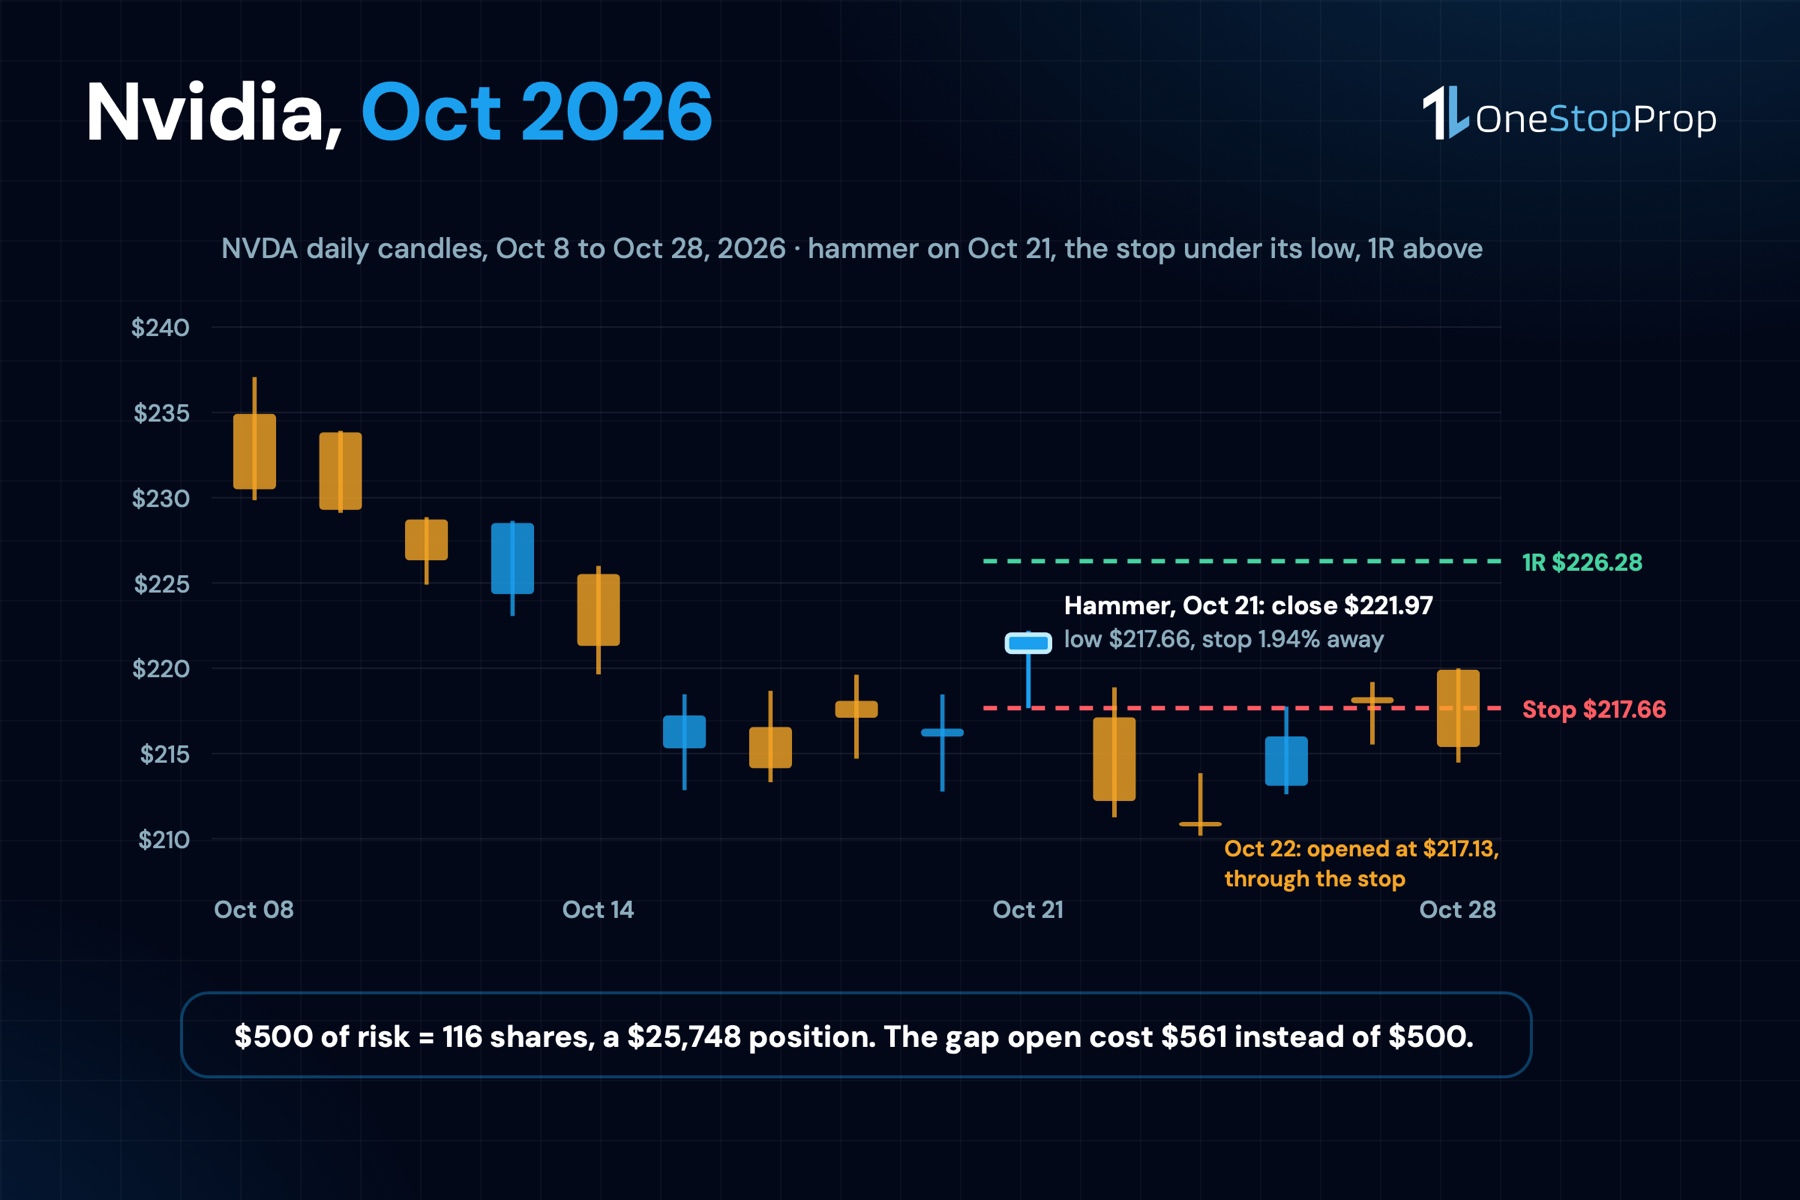
Nvidia, October 21, 2026. The stock had closed at $228.52 on October 13 and at $216.47 on October 20, a 5-session decline. On the 21st it opened at $220.96, fell to $217.66, and closed at $221.97, with a high of $222.19. Body $1.01, range $4.53, lower wick $3.30, upper wick $0.22. A hammer.
The stop goes under $217.66, which is $4.31 below the close, 1.94%. $500 of risk is 116 shares, a $25,748 position. $1,000 is 232 shares, $51,497.
The next session, October 22, NVDA opened at $217.13, already under the stop, and closed at $212.21, 4.4% lower. A stop loss order filled around the open, which on 116 shares is a loss of about $561 rather than $500: the gap cost $61, the difference the stop loss vs stop limit guide is about. On a $100K 1 Step or 2 Step account that is 0.56% against a 4% daily limit. The pattern failed and the day was fine.
Palantir, July 31, 2026. Close $123.37 on July 23, $122.26 on July 30. On the 31st: open $122.29, low $119.62, high $123.39, close $123.06. Body $0.77, range $3.77, lower wick $2.67, upper wick $0.33. The stop under $119.62 is $3.44 away, 2.80%. $500 buys 145 shares, $17,844.
The next session closed at $125.65, up 2.1%, and on August 3 the high of $126.97 passed the 1R level of $126.50. Then came August 4, a 15.5% gap on earnings, and the stock closed the fifth session at $172.01. The hammer did not predict that. It put the stop $3.44 away and let a trader be long with a small, known risk when it happened.
1 stop, 1 winner, same definition. The example is not the lesson; the size is.
How to Trade Candlestick Patterns on a Funded Account
1. Write the definition down. Body, wicks, range, prior trend, in numbers. A pattern you recognize by eye on Tuesday and not on Wednesday is a mood.
2. Require the trend. A hammer without a decline before it is a candle with a long lower wick. The scan demanded a lower close than 5 sessions earlier, and that filter alone cut the hammer count from 1,658 to 798.
3. Set the stop at the candle, not at a round number. The hammer’s low, the shooting star’s high, the outer edge of the engulfing pair. Those are the prices where the pattern is wrong.
4. Size from the stop. Risk per trade divided by the distance. At a median 2% stop, $500 of risk on a $100K 1 Step or 2 Step account is roughly $25,000 of stock. On Instant, where the daily limit is 2% of the balance rather than 4%, the same proportion of the limit is $250 of risk and about $12,500 of stock.
5. Take the 1-day edge, or none. The patterns that worked, worked for 1 session and were gone by the fifth. If the plan is to hold a hammer for a week, a support and resistance trading level under the low is a better reason to stay in than the candle is.
6. Mind the gap and the news window. The NVDA stop filled $61 worse than planned because the stock opened through it. On a funded account every position also has to be closed 5 minutes before and after FOMC, NFP, CPI, PPI and the stock’s own earnings unless the account carries the News Trading Allowed Add-On, per the Help Center’s news trading page.
Common Mistakes With Candlestick Patterns
Trading the shape without the trend
A long lower wick in the middle of a range is not a hammer. Every book attaches the pattern to a prior move, and without it the count doubles.
Expecting the engulfing candle to lead
The bullish engulfing was the most common reversal pattern on the list and the only one that pointed the wrong way. A big up candle after a week down is often the bounce, not the turn.
Frequently Asked Questions
Which candlestick patterns are the most reliable?
On this scan of 66,882 sessions of OneStopProp’s stock list, the hammer and the shooting star: 53.1% and 52.1% for the next session’s direction against base rates of 50.3% and 49.7%. The bullish engulfing pointed the wrong way at 44.9%, the bearish engulfing was within 1.4 points of its base, and the doji was a coin.
Do candlestick patterns work on daily charts?
A little, for 1 session, under a fixed definition. Every edge this scan found was gone by the fifth session. What they do reliably is put a stop at a known price 2% to 3% from the entry.
Does volume confirm a candlestick pattern?
Not on this data. Hammers on 1.5 times normal volume did slightly worse than quiet ones, and bullish engulfing candles on heavy volume were followed by an up close only 33.2% of the time. The heavy-volume shooting star was the one exception, at 55.6% on 90 cases.
Where does the stop go on a hammer?
Below the candle’s low. On 798 hammers on OneStopProp’s list the median distance from the close to that low was 2.01% of the price, so $500 of risk bought a $24,876 position. On a $100K 1 Step or 2 Step account the daily loss limit is $4,000; on Instant, $2,000.
Should you trade candlestick patterns on a funded account?
As a stop location, yes. As a forecast, only for the next session and only with the trend filter. Size from the distance to the candle’s extreme, keep the risk per trade at a fraction of the daily limit, and expect the stop to come first about as often as 1R does.
The Bottom Line
Candlestick patterns, counted on 66,882 sessions, are a small edge that lasts a day, a pattern that points backwards, and a doji that points nowhere. That is less than the books promise and more than nothing.
What they give a funded trader is a stop at a known price about 2% away, far tighter than the head and shoulders stop this blog measured, and a position size that follows from it in 1 division. The stop is what keeps the account inside its limit on the days the candle is wrong, and it is wrong almost half the time.
If you want to run those definitions with the daily and total loss limits written down before the first candle prints, start a funded account at OneStopProp: 1 Step, 2 Step or Instant, from $10K to $300K, with U.S. stock CFDs on the same list this scan used, no time limit on the challenge, and positions you can hold overnight and over the weekend.
Sources
- Candlestick chart, Nasdaq glossary. A charting method that displays an asset’s opening, closing, high and low prices for the period as a real body with a line on top and bottom. https://www.nasdaq.com/glossary/c/candlestick-chart
- Historical Quotes, Nasdaq. Daily open, high, low, close and volume for the stocks on OneStopProp’s instrument list, 2 years to November 3, 2026, used for the scan and the NVDA and PLTR examples. https://www.nasdaq.com/market-activity/quotes/historical
- Hammer, Bulkowski’s ThePatternSite.com. Identification guidelines and the tested reversal rate of 60%, with the author’s note that it is not far from random. https://thepatternsite.com/Hammer.html
- Shooting Star, Bulkowski’s ThePatternSite.com. Reversal 59% of the time, described as near random. https://thepatternsite.com/ShootingStar.html
- Bullish Engulfing, Bulkowski’s ThePatternSite.com. Reversal 63% of the time, overall performance rank 84 of 103. https://thepatternsite.com/BullEngulfing.html
- Bearish Engulfing, Bulkowski’s ThePatternSite.com. Reversal 79% of the time, with the trend after the breakout ranking 91st and described as short-lived. https://thepatternsite.com/BearEngulfing.html
- Long Legged Doji, Bulkowski’s ThePatternSite.com. The breakout direction after a doji is random. https://thepatternsite.com/LongLegDoji.html
- What Instruments Can I Trade?, OneStopProp Help Center. The U.S. stock CFD list the scan covered. https://help.onestopprop.com/faq/what-instruments-can-i-trade/
- What is the Maximum Daily Loss?, OneStopProp Help Center. 4% of the initial balance on 1 Step and 2 Step, 2% on Instant, measured at 12:00 AM EST. https://help.onestopprop.com/faq/what-is-the-maximum-daily-loss/
- Is news trading allowed?, OneStopProp Help Center. The 5-minute window around FOMC, NFP, CPI, PPI and earnings on funded accounts, and the News Trading Allowed Add-On. https://help.onestopprop.com/faq/is-news-trading-allowed/