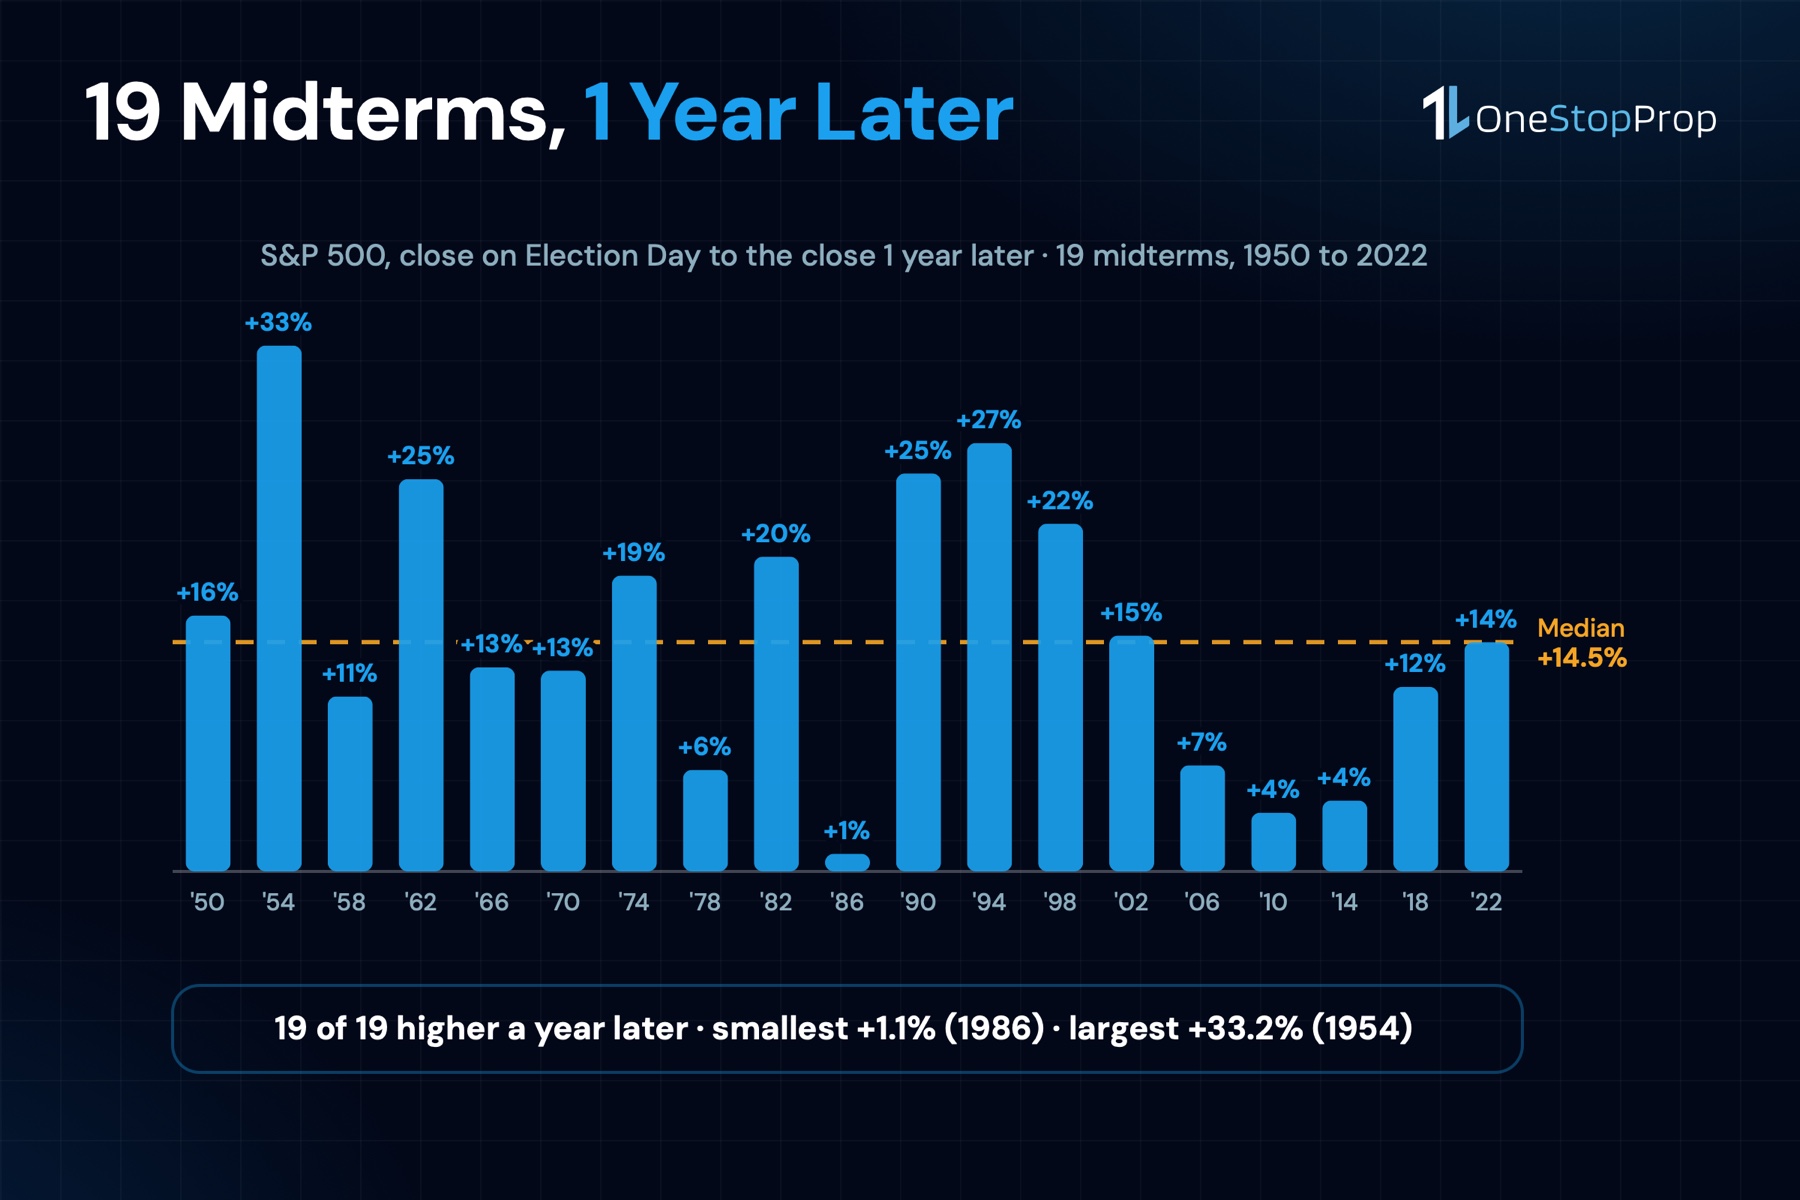
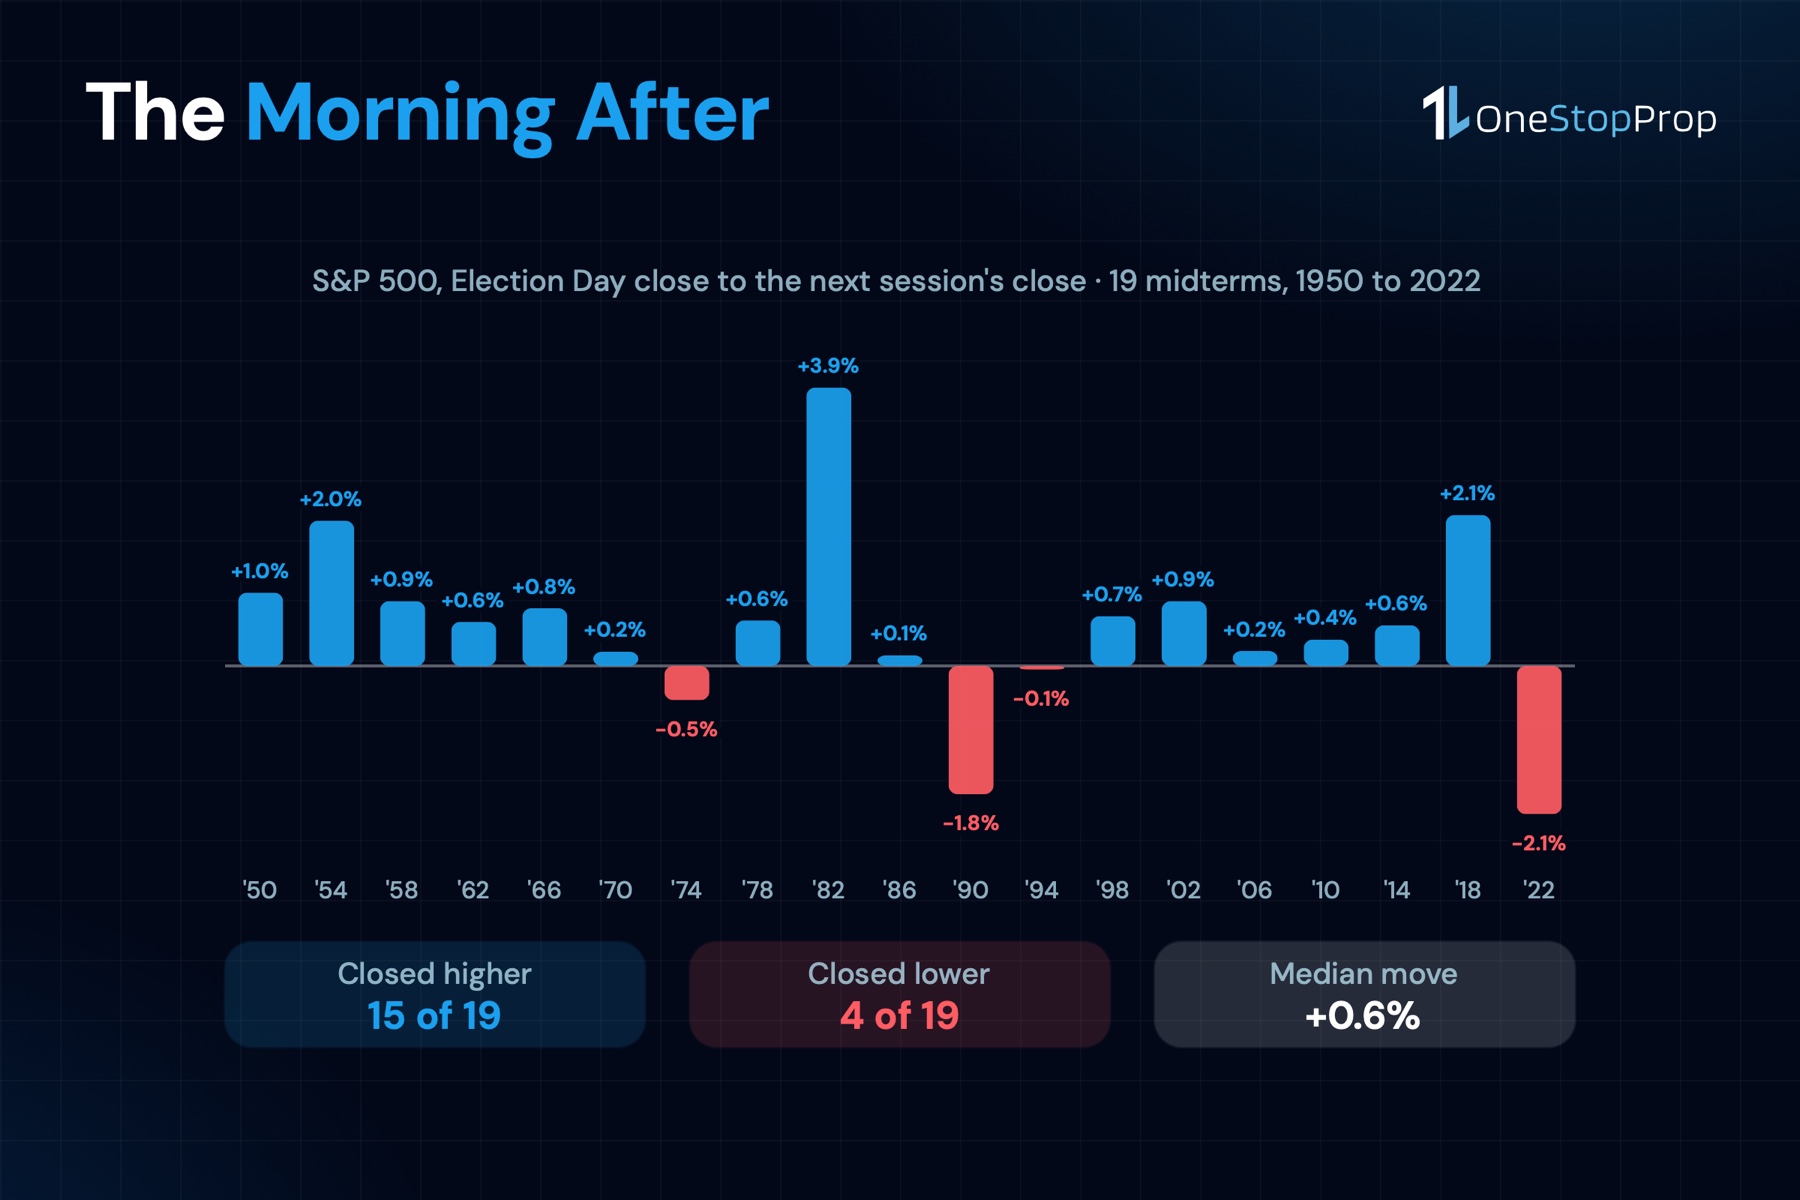
The stock market after midterm elections has one of the cleanest records in the calendar. In the 19 midterms since 1950, the S&P 500 was higher 1 year after Election Day every single time, with a median gain of 14.5%. The day after the vote is a different story: up 15 times, down 4, and the 2 most recent reactions, 2018 and 2022, were the 2 largest since 1982 and pointed in opposite directions.
The 2026 midterm election is Tuesday, November 3. The market is open that day, the news-window rule on a funded account does not mention elections, and the jobs report lands 3 days later. That combination is why a funded trader needs a plan for this week rather than an opinion about the result.
This guide measures what the stock market after midterm elections actually did, from the next session to the next year, using daily S&P 500 closes and daily VIX closes. Then it turns the numbers into sizing decisions for a funded account, where the daily loss limit does not care who won.
Key Takeaways
- 1 year later, 19 of 19. The S&P 500 closed higher 1 year after every midterm since 1950. Median gain 14.5%, smallest 1.1% (1986), largest 33.2% (1954).
- The next day is a coin with a heavy side. Up 15 of 19 times, median +0.6%. The 2 most recent reactions were +2.1% (2018) and -2.1% (2022), so the size of the move is the risk, not the direction.
- Election Day itself is quiet. Since 1970 the index has traded on every midterm Election Day and moved between -1.4% and +2.8%, with 10 of 14 sessions closing up.
- The fear comes before the vote. In 6 of the 9 midterms since 1990, the VIX’s highest close in the 20 sessions before Election Day was above every close in the 20 sessions after.
- On a funded account, elections are not a news-window event. OneStopProp’s restricted list is FOMC, Fed Chair speeches, NFP, CPI, PPI and earnings. Election night is a sizing decision, and the NFP on Friday, November 6 is the rule you have to watch.
What a Midterm Election Is, and Why the Market Cares
A midterm election is the congressional election that lands halfway through a presidential term. USAGov’s page on congressional and midterm elections lays out what is on the ballot: all 435 seats in the House of Representatives and one third of the Senate, which together decide which party holds the majority in each chamber for the next 2 years.
The market cares for 2 reasons. The first is policy: tax, spending and regulation bills need both chambers, and a split result changes what can pass. The second is simpler and matters more for a trader: uncertainty gets resolved. For weeks the result is a range of outcomes, and on Wednesday morning it is a fact. Markets price facts faster than ranges.
That second reason is why the historical pattern looks the way it does. The stock market after midterm elections does not rally because one party won. It has rallied, over the following year, after both parties won, after split results, and after wave elections in both directions.
One practical point before the data. Election Day is a normal trading day. The NYSE holiday calendar for 2026 lists Thanksgiving on November 26 and Christmas on December 25 as the remaining closures of the year; the first Tuesday of November is not on it. The exchange used to close on Election Day: in the data below, 1950 through 1966 show no session on the vote itself, and every midterm since 1970 does.
The Stock Market After Midterm Elections: 19 Midterms Since 1950
The table uses the S&P 500’s daily closes from Yahoo Finance, measured from the close on Election Day (or the close before it, in the years the exchange was shut) to 5 checkpoints.
| Checkpoint after Election Day | Higher | Lower | Median move | Best | Worst |
|---|---|---|---|---|---|
| Next session | 15 | 4 | +0.6% | +3.9% (1982) | -2.1% (2022) |
| 5 sessions | 14 | 5 | +1.4% | +4.3% (1954) | -3.5% (2002) |
| 21 sessions (about 1 month) | 15 | 4 | +2.3% | +7.9% (1962) | -12.0% (1974) |
| October 31 to December 31 | 13 | 6 | +3.2% | +13.6% (1954) | -7.6% (2018) |
| 1 year | 19 | 0 | +14.5% | +33.2% (1954) | +1.1% (1986) |
3 things stand out.
The 1-year number is the one that gets quoted, and it holds. 19 for 19 over 7 decades is unusual for any calendar pattern. The weakest case, 1986, still finished up 1.1% despite the October 1987 crash landing inside that window.
The short windows are not a free trade. 4 of 19 next sessions were down, 5 of 19 first weeks were down, and the first month after the 1974 midterm fell 12.0% inside a bear market. A funded trader who treats “stocks rise after midterms” as a reason to hold more size into Wednesday is borrowing a 1-year statistic to justify a 1-day position.
The year-end window is softer than its reputation. The November to December stretch of a midterm year was positive 13 of 19 times, and the 2 worst were recent: 2018 (-7.6%) and 2022 (-0.8%). The Santa Claus Rally covers the last days of that window and has its own data.
Election Day Itself Is Not the Event
The vote happens while the market is open, but the result does not. Polls close after the bell, counting runs overnight, and the first session that trades on a known outcome is Wednesday.
The data agrees. Across the 14 midterms since 1970 where the exchange was open on Election Day, the S&P 500 moved between -1.4% (1978) and +2.8% (1974) on the day, closing up 10 times. The median move was +0.6%. Those are ordinary sessions.
The next session is where the size shows up. Here are the 2 most recent ones:
- November 7, 2018: +2.1%, the best post-midterm session since 1982.
- November 9, 2022: -2.1%, which gave back more than the index had gained on Election Day itself (+0.6%).
2 reactions, 2 directions, both bigger than 2%. For an index. Individual stocks move more than the index on a day like that, and a funded account is a collection of individual positions, each with its own gap.
Volatility: October Carries the Fear, the Vote Releases It
The VIX, Cboe’s 30-day implied volatility index for the S&P 500, has daily closes back to 1990 on Cboe’s historical data page. That covers 9 midterms. 3 observations from them:
| Midterm | VIX on election eve | VIX next session | Highest close, 20 sessions before | Highest close, 20 sessions after |
|---|---|---|---|---|
| 1990 | 29.9 | 30.9 | 34.0 | 30.9 |
| 1994 | 17.4 | 16.4 | 17.4 | 18.4 |
| 1998 | 27.3 | 27.4 | 45.7 | 29.3 |
| 2002 | 30.8 | 30.7 | 42.1 | 31.4 |
| 2006 | 11.2 | 10.8 | 11.7 | 12.3 |
| 2010 | 21.8 | 19.6 | 21.8 | 23.5 |
| 2014 | 14.7 | 14.2 | 26.2 | 14.3 |
| 2018 | 20.0 | 16.4 | 25.2 | 22.5 |
| 2022 | 24.4 | 26.1 | 33.6 | 26.1 |
- The vote itself did not spike volatility. In all 9 cases the VIX closed within 2.2 points of its election-eve level on the day after. In 6 of 9 it fell or stayed flat.
- The high came before the election, not after. In 6 of 9 midterms the highest VIX close in the 20 sessions before the vote was above every close in the 20 sessions after. The 3 exceptions (1994, 2006, 2010) all started from a VIX already below 22.
- The daily range of the S&P 500 barely changed. Comparing the average absolute daily move in the 10 sessions before and after each midterm since 1950, the “after” was larger in 10 of 19 cases. That is a coin flip, not an effect.
Going into November 3, 2026, the VIX closed at 19.4 on October 30, after an October high of 23.9 intraday on that same day. That is a middle reading by the standards of the table: above 2006, 2014 and 1994, below 1990, 1998, 2002 and 2022.
The lesson for a funded account is not “volatility will fall”. It is that the week of the vote has not historically been the most dangerous week of the autumn, and that the real exposure is the size of the gap on one morning rather than a change in the market’s regime.
What Changes on a Funded Account During Election Week
Nothing in OneStopProp’s rules is written about elections, and that absence is the point. The rules that do apply are the same ones that apply every week, so here is how each one meets this particular week.
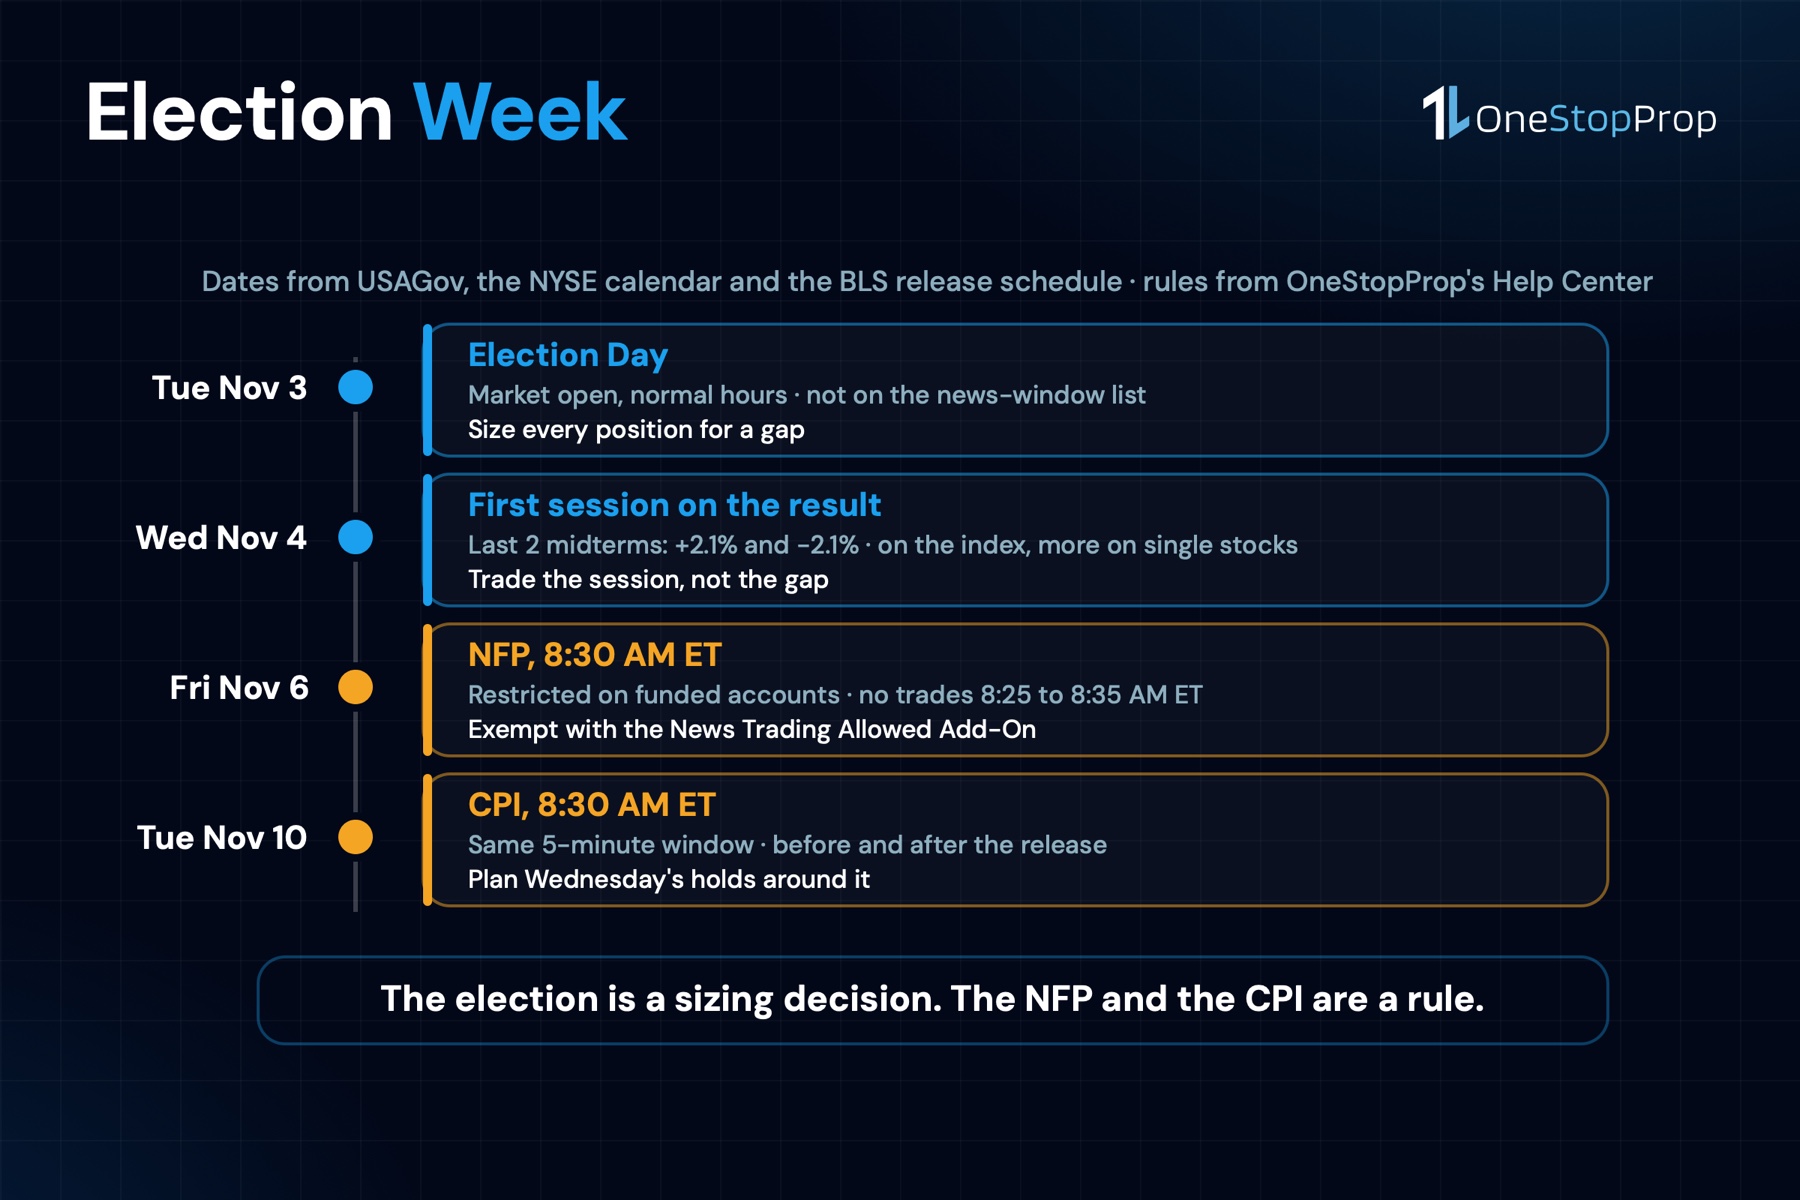
The news window does not include the vote. The Help Center’s answer to Is news trading allowed? is specific: on funded accounts, all trades must be closed 5 minutes before and may not be opened until 5 minutes after FOMC announcements and Fed Chair speeches, NFP, CPI, PPI and individual stock earnings reports. Elections are not on that list. There is no rule stopping you from holding through Tuesday night, which means the decision is entirely a sizing decision.
The news window does include Friday. The Bureau of Labor Statistics releases the October jobs report, the NFP, on Friday, November 6 at 8:30 AM ET, and the October CPI on Tuesday, November 10 at 8:30 AM ET. Both are inside the restricted window on a funded account without the News Trading Allowed Add-On. The Federal Reserve’s October meeting was on the 27th and 28th, so there is no FOMC decision in election week. Trading earnings releases covers how the same 5-minute rule works around a company report, and earnings season is still running this week.
Overnight holds are allowed, with the gap on your side of the ledger. The Help Center confirms you can hold overnight and over weekends. The daily loss limit is 4% of the initial balance on 1 Step and 2 Step and 2% on Instant, measured at 12:00 AM ET from the higher of balance or equity. A gap at Wednesday’s open counts against Wednesday’s limit in full.
Here is the arithmetic on a $100K 2 Step account, with a $4,000 daily limit. Suppose you hold $60,000 of notional exposure in 3 stocks through Tuesday night. A 3% gap against you is $1,800, which is 45% of the daily limit before the first trade of the day. On a $100K Instant account, where the limit is 2% or $2,000, the same gap uses 90% of it. Same stocks, same news, and one route is 1 bad trade away from a breach at 9:31 AM.
The index moved 2.1% the morning after each of the last 2 midterms. Stocks do not move like the index; they spread around it. On November 9, 2022, the session after the last midterm, the S&P 500 fell 2.1%. Of the 140 stocks on OneStopProp’s current list that were trading that day, 72 moved 2% or more, 54 moved 3% or more and 30 moved 5% or more. The median move was 2.2%, and the range ran from +6.2% (AKAM) to -21.0% (RBLX). If your 3 names are the kind that show up on a most volatile stocks list, 3% is a conservative assumption, not a worst case.
Pro Tip: before Tuesday’s close, write down 2 numbers for every open position: the dollar loss at a 3% gap against you, and the total across positions as a share of your daily limit. If the total is above 50%, you are not holding a view on the election; you are holding a view on a number you cannot stop out of.
Halts and wide opens are still possible on a single name. A stock that is a direct beneficiary or victim of a specific result can open on a gap wide enough to trigger a volatility pause. Trading halts explains what happens to a stop inside one: nothing fills until the reopen.
A 4-Step Plan for Election Week on a Funded Account
The numbers above turn into 4 decisions, in order.
- Decide Tuesday afternoon how much gap you are willing to own. Add up the 3% scenario across positions. Cut size until the total sits where you want it relative to the daily limit. Half is a reasonable ceiling for a trader who wants to keep trading Wednesday; a quarter is better.
- Trade Wednesday’s session, not Tuesday’s night. 15 of 19 post-midterm sessions closed up, but the ones that did not were not small. The reaction is tradable in the open market with a stop that fills. The gap is not. The best time to day trade stocks on a reaction day is usually the first 90 minutes, after the opening range has shown which way the resolution is being priced.
- Respect the Friday window. The NFP at 8:30 AM ET on November 6 means no open trades from 8:25 to 8:35 AM ET on a funded account without the Add-On. On an election week, with positions you may have put on Wednesday, that is the rule most likely to be broken by accident.
- Do not trade the headline. The 1-year statistic is real and it is not a reason to buy more on Wednesday. If the market rallies for the next 12 months the way it has after every midterm since 1950, a position opened on November 20 at normal size participates in almost all of it. A position doubled on November 4 participates in the first gap and might not survive the second.
Common Mistakes in the Week of a Midterm
Holding full size through the vote because “stocks rise after midterms”
They did, over 12 months, 19 times out of 19. Over 1 session they fell 4 times out of 19, and the 2022 drop was 2.1% on the index. The statistic and the position are on different time frames.
Treating Election Day as the news day
The vote happens Tuesday; the market prices it Wednesday. Election Day sessions since 1970 have been ordinary, with a median move of +0.6%. Sizing for Tuesday and ignoring Wednesday is backwards.
Forgetting that Friday is NFP
It is easy to spend the week thinking about the election and walk into 8:30 AM Friday with a position open. On a funded account without the News Trading Allowed Add-On, that is a rule breach, not a bad trade.
Confusing the index with your stocks
A 2% index move is the average of many stocks moving more and less than 2%. On November 9, 2022, 54 of the 140 stocks on OneStopProp’s list that traded that day moved 3% or more while the index fell 2.1%. A funded account does not hold the average. It holds 3 names, each with its own reaction.
Picking a side
The record is 19 for 19 across results of every kind. The data does not reward predicting the winner. It rewards surviving the morning after and being present for the year.
Frequently Asked Questions
Is the stock market open on Election Day 2026?
Yes. Election Day, Tuesday, November 3, 2026, is a regular trading day. The NYSE’s 2026 holiday calendar lists Thanksgiving (November 26) and Christmas (December 25) as the remaining closures of the year. The exchange closed on Election Day decades ago; since 1970 it has traded on every midterm Election Day.
What does the stock market do after midterm elections?
Measured on the S&P 500 since 1950, the stock market after midterm elections was higher 1 year later in all 19 cases, with a median gain of 14.5%. The next session was up 15 of 19 times, and the first month was up 15 of 19, with the worst month being -12.0% in 1974.
Does it matter which party wins the midterms?
Not in the 1-year record. The S&P 500 rose over the following year after every midterm since 1950, across results that favored each party and across split outcomes. The data here does not separate by winner, because the pattern did not depend on one.
Can I hold a funded account position through election night?
Yes. Elections are not on OneStopProp’s restricted news list, and overnight holds are allowed on all routes. The question is sizing: a gap at Wednesday’s open counts against Wednesday’s daily loss limit in full, which is 4% on 1 Step and 2 Step and 2% on Instant.
Is there a news-window restriction in election week?
Yes, but not for the vote. The October NFP is Friday, November 6 at 8:30 AM ET and the October CPI is Tuesday, November 10 at 8:30 AM ET. Both are restricted events on a funded account without the News Trading Allowed Add-On: trades closed 5 minutes before, none opened until 5 minutes after.
Does volatility spike after midterm elections?
Historically, no. In the 9 midterms since 1990, the VIX closed within 2.2 points of its election-eve level on the day after, and in 6 of 9 the highest VIX close of the 20 sessions before the vote was above every close in the 20 sessions after.
The Bottom Line
The stock market after midterm elections has a record that is easy to quote and easy to misuse. 19 of 19 midterms since 1950 were followed by a higher S&P 500 a year later. 4 of 19 were followed by a lower S&P 500 the next morning, and the last 2 reactions moved more than 2% in opposite directions.
On a funded account the second number is the one that can end the month. Elections are not in the news window, so nothing stops you from holding through Tuesday night; the daily loss limit is what decides whether you should. Size the gap, trade the session, respect Friday’s NFP, and let the 1-year pattern do its work on positions that survived the first morning.
If you want to trade this week with the daily and total loss limits written down before the first result is called, start a funded account at OneStopProp: 1 Step, 2 Step or Instant, from $10K to $300K, with U.S. stock CFDs, forex, indices, commodities, metals and crypto in the same account, no time limit and overnight holds allowed.
Sources
- Congressional elections and midterm elections, USAGov. What a midterm election decides: all 435 House seats and one third of the Senate, every 2 years, with the next midterm in November 2026. https://www.usa.gov/midterm-elections
- Holidays & Trading Hours, New York Stock Exchange. The 2026 holiday calendar, with Thanksgiving (November 26) and Christmas (December 25) as the remaining closures; Election Day is not a market holiday. https://www.nyse.com/trade/hours-calendars
- S&P 500 (^GSPC) Historical Data, Yahoo Finance. Daily closes from 1950 used to measure the index after each midterm, downloaded November 2, 2026. https://finance.yahoo.com/quote/%5EGSPC/history/
- VIX Historical Data, Cboe Global Markets. Daily VIX closes from 1990 used for the volatility table, downloaded November 2, 2026. https://www.cboe.com/tradable_products/vix/vix_historical_data/
- Historical Quotes, Nasdaq. Daily closes for the stocks on OneStopProp’s instrument list, used to measure the moves of November 9, 2022, downloaded November 2, 2026. https://www.nasdaq.com/market-activity/quotes/historical
- Schedule of Releases for the Employment Situation, U.S. Bureau of Labor Statistics. The October 2026 jobs report is released Friday, November 6, 2026 at 8:30 AM ET. https://www.bls.gov/schedule/news_release/empsit.htm
- Schedule of Releases for the Consumer Price Index, U.S. Bureau of Labor Statistics. The October 2026 CPI is released Tuesday, November 10, 2026 at 8:30 AM ET. https://www.bls.gov/schedule/news_release/cpi.htm
- Meeting calendars and information, Board of Governors of the Federal Reserve System. The 2026 FOMC meeting dates, with the October meeting on the 27th and 28th. https://www.federalreserve.gov/monetarypolicy/fomccalendars.htm
- Is news trading allowed?, OneStopProp Help Center. The 5-minute window before and after FOMC, Fed Chair speeches, NFP, CPI, PPI and earnings on funded accounts, and the News Trading Allowed Add-On. https://help.onestopprop.com/faq/is-news-trading-allowed/
- Can I hold trades overnight and over weekends?, OneStopProp Help Center. Overnight and weekend holds are allowed. https://help.onestopprop.com/faq/can-i-hold-trades-overnight-and-over-weekends/
- What is the Maximum Daily Loss?, OneStopProp Help Center. The 4% daily limit on 1 Step and 2 Step, 2% on Instant, measured at 12:00 AM ET. https://help.onestopprop.com/faq/what-is-the-maximum-daily-loss/