A VWAP trading strategy is usually taught as a line on a chart: above it you are bullish, below it you are bearish. That is the smallest part of what the line does, and on a funded account it is not the part that decides anything.
What decides things is distance. VWAP sits at a specific price, your entry sits at another, and the gap between them is the stop you are about to accept. That gap sets your position size, and your position size is what meets the daily loss limit at the end of a bad session.
Key Takeaways
- VWAP is a running average of price weighted by volume, and it resets every session. It is not a moving average carried over from yesterday, which is why it behaves differently at 9:35 AM than at 3:00 PM ET.
- The distance from your entry to VWAP is the stop you are accepting. That distance, not the chart pattern, is what sets how many shares you can take.
- Position size comes out of 1 division. Dollar risk per trade divided by the distance to VWAP equals the share count, and nothing about the setup changes that arithmetic.
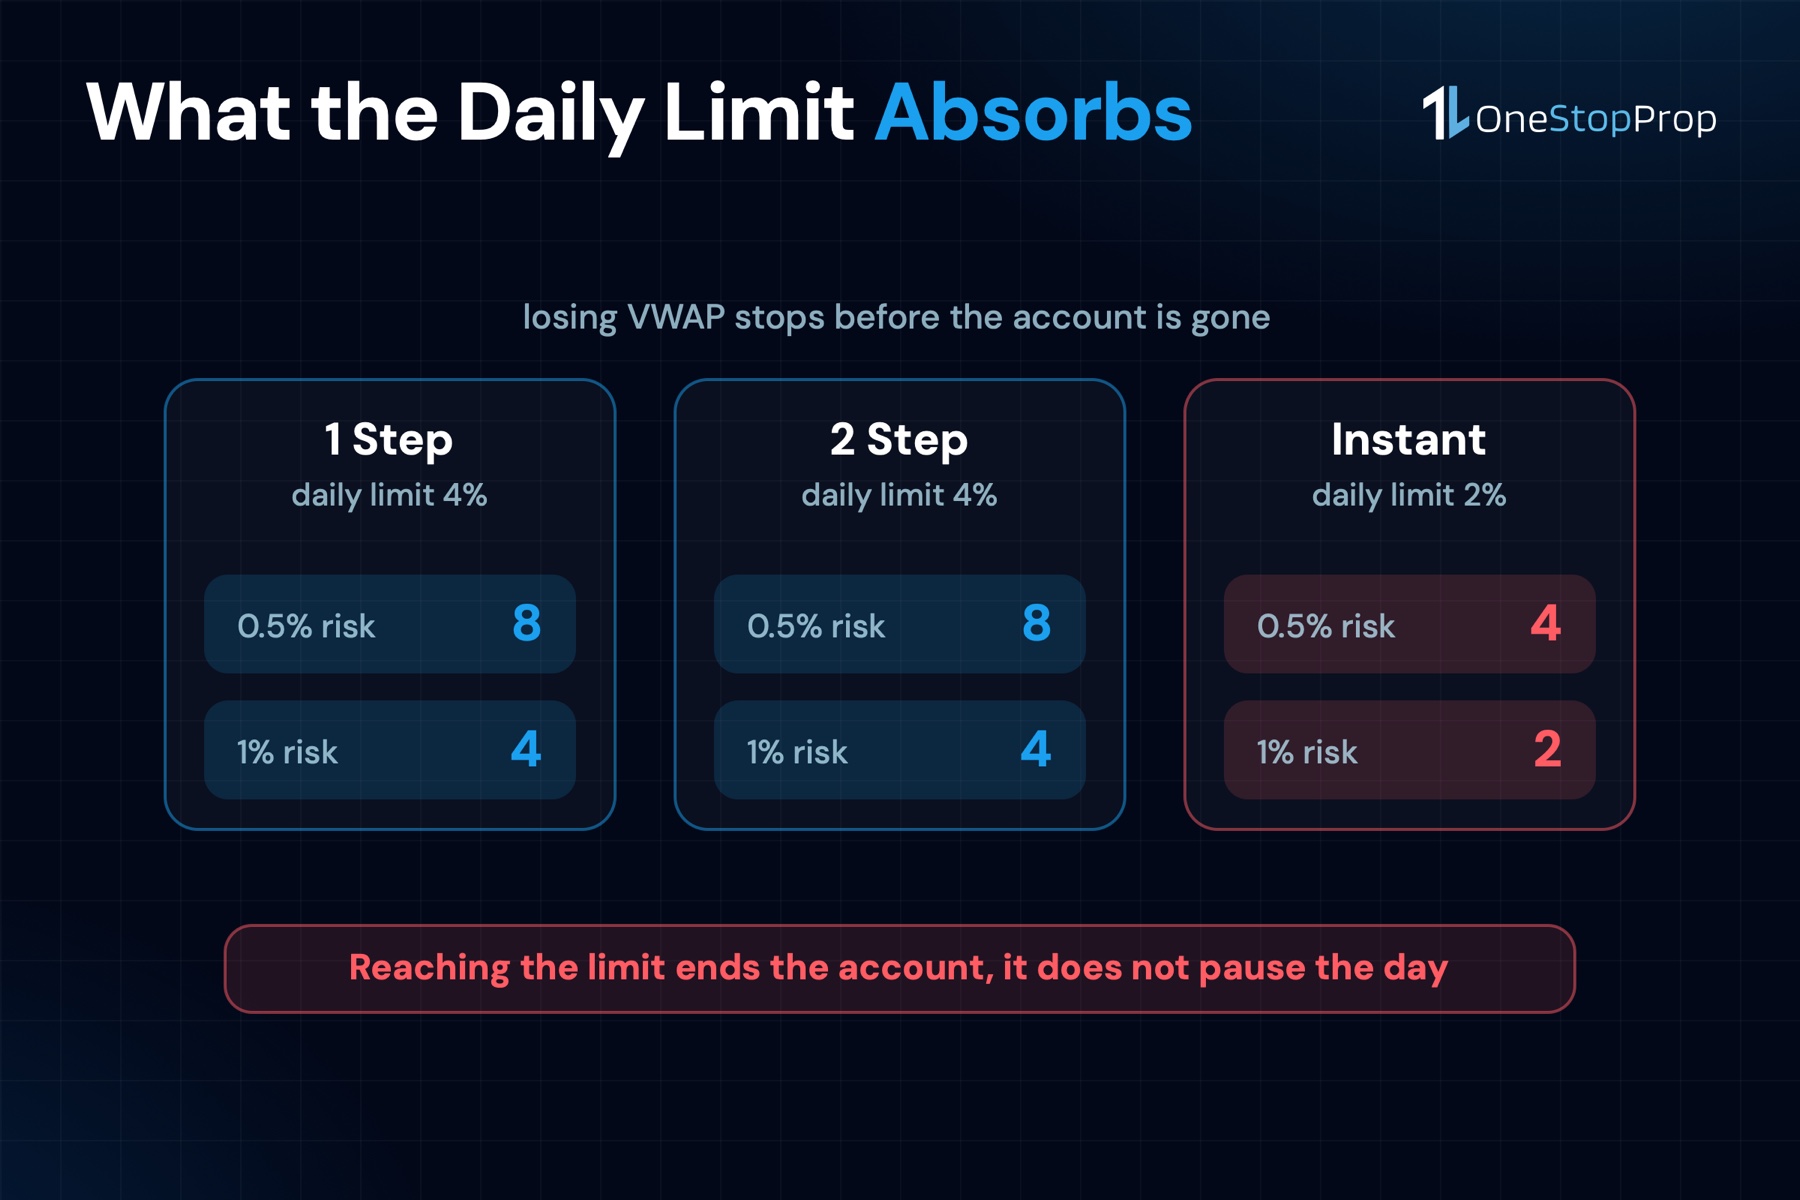
- The daily loss limit caps how many of those trades you get. At 0.5% risk per trade, a 4% daily limit on 1 Step and 2 Step absorbs 8 of them, and the 2% limit on Instant absorbs 4.
- Early in the session VWAP is built on very little volume. The first prints carry disproportionate weight, which is why the line moves most in the opening minutes.
What VWAP Actually Is
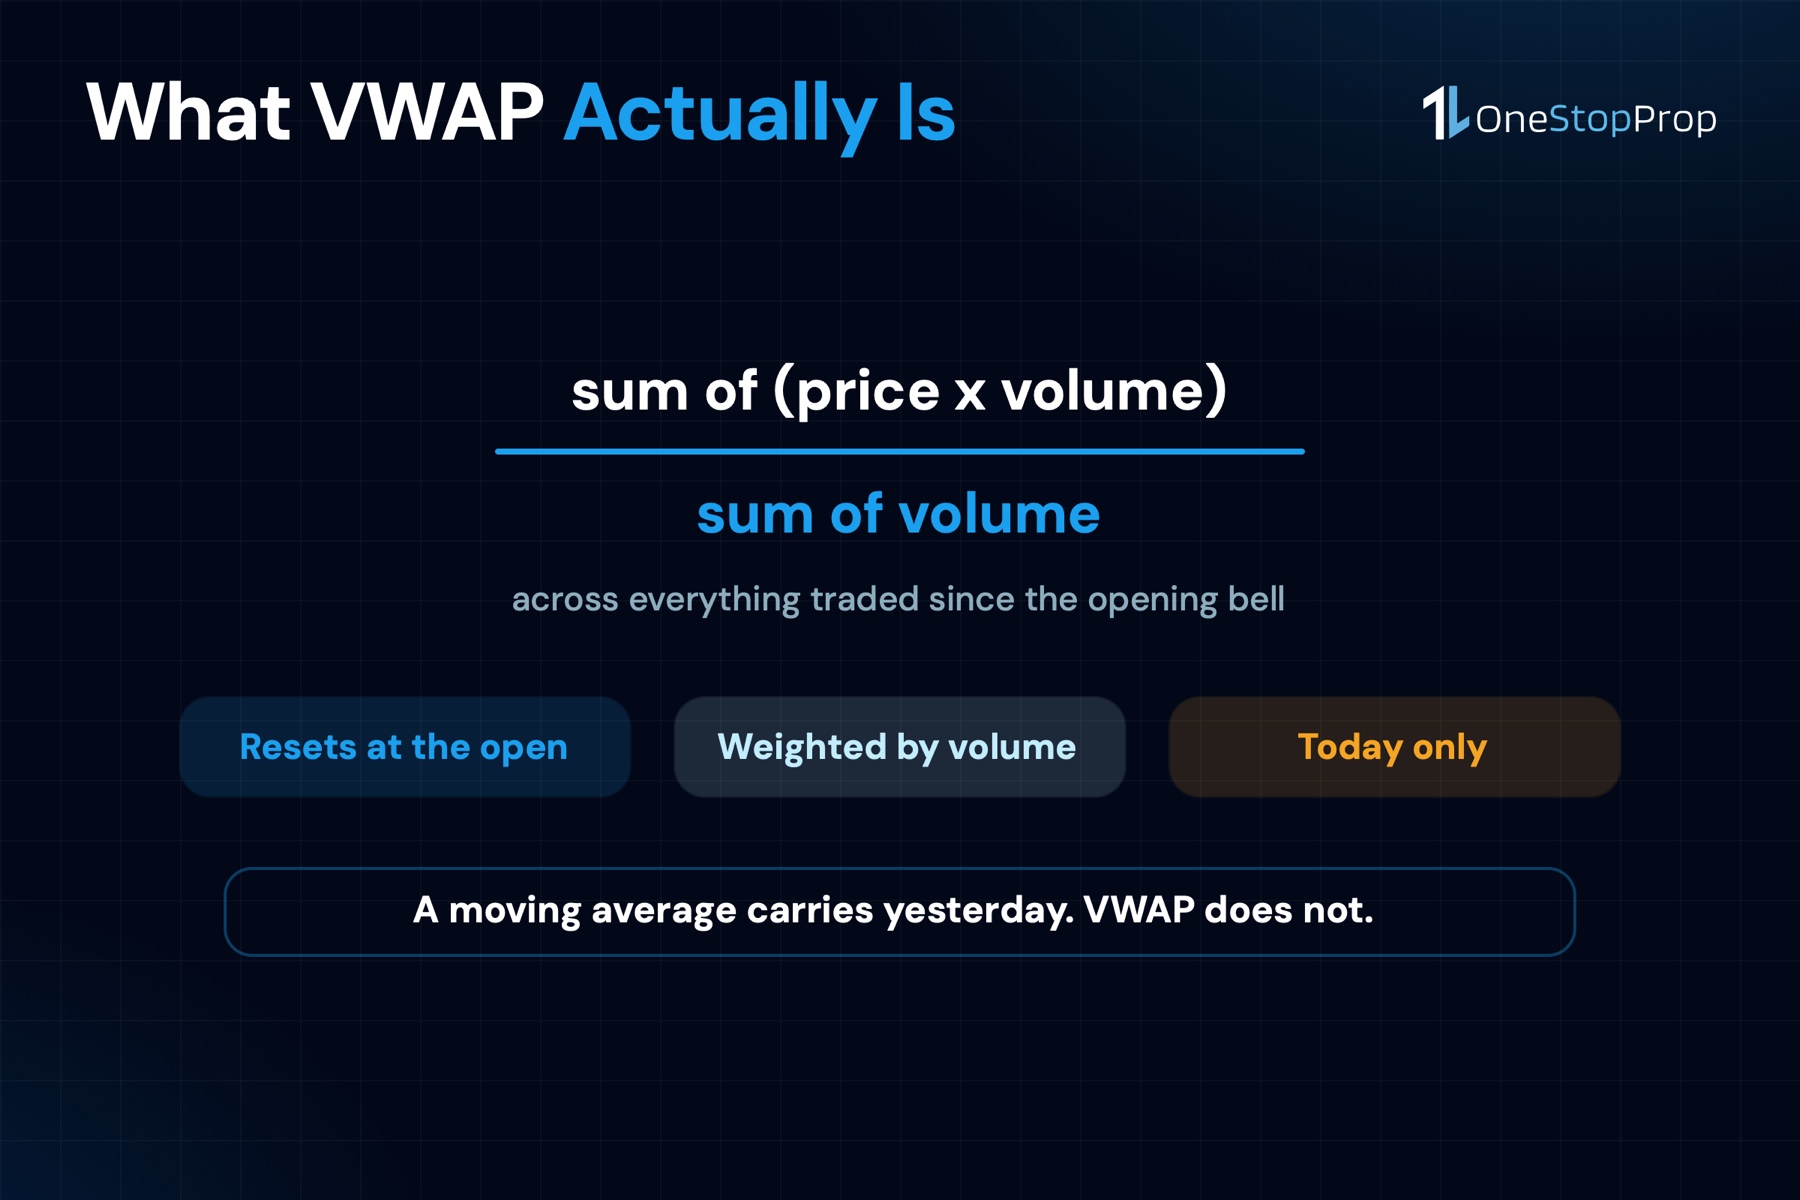
VWAP stands for volume weighted average price. It answers a narrow question: across everything traded so far today, what is the average price each share changed hands at?
The calculation runs cumulatively through the session. Each bar contributes its price multiplied by its volume, those products are added up, and the total is divided by the total volume traded. A bar that trades 2 million shares moves the line far more than a bar that trades 50,000.
The part most traders skip is the reset. VWAP starts fresh at the opening bell and knows nothing about yesterday. A 20 period moving average carries history. VWAP does not.
Why the Reset Matters on a Funded Account
At 9:35 AM ET, VWAP has maybe 5 minutes of volume behind it. The line is sensitive, it jumps, and a stop placed at it is a stop placed on a number that is still forming.
By the afternoon the same line sits on hours of accumulated volume and barely moves. The same strategy, the same chart, 2 completely different stop distances.
That matters because a funded account is scored on the distance, not on the idea. A VWAP stop in the first 10 minutes can be 3 times wider than the same stop at 2:00 PM, and a position sized as if they were equal is how a single trade eats most of a daily loss limit.
Pro Tip: Before sizing a VWAP trade, read the distance in dollars, not in percent and not by eye. The number you need is the gap between your entry and the line, because that is what you divide into your risk.
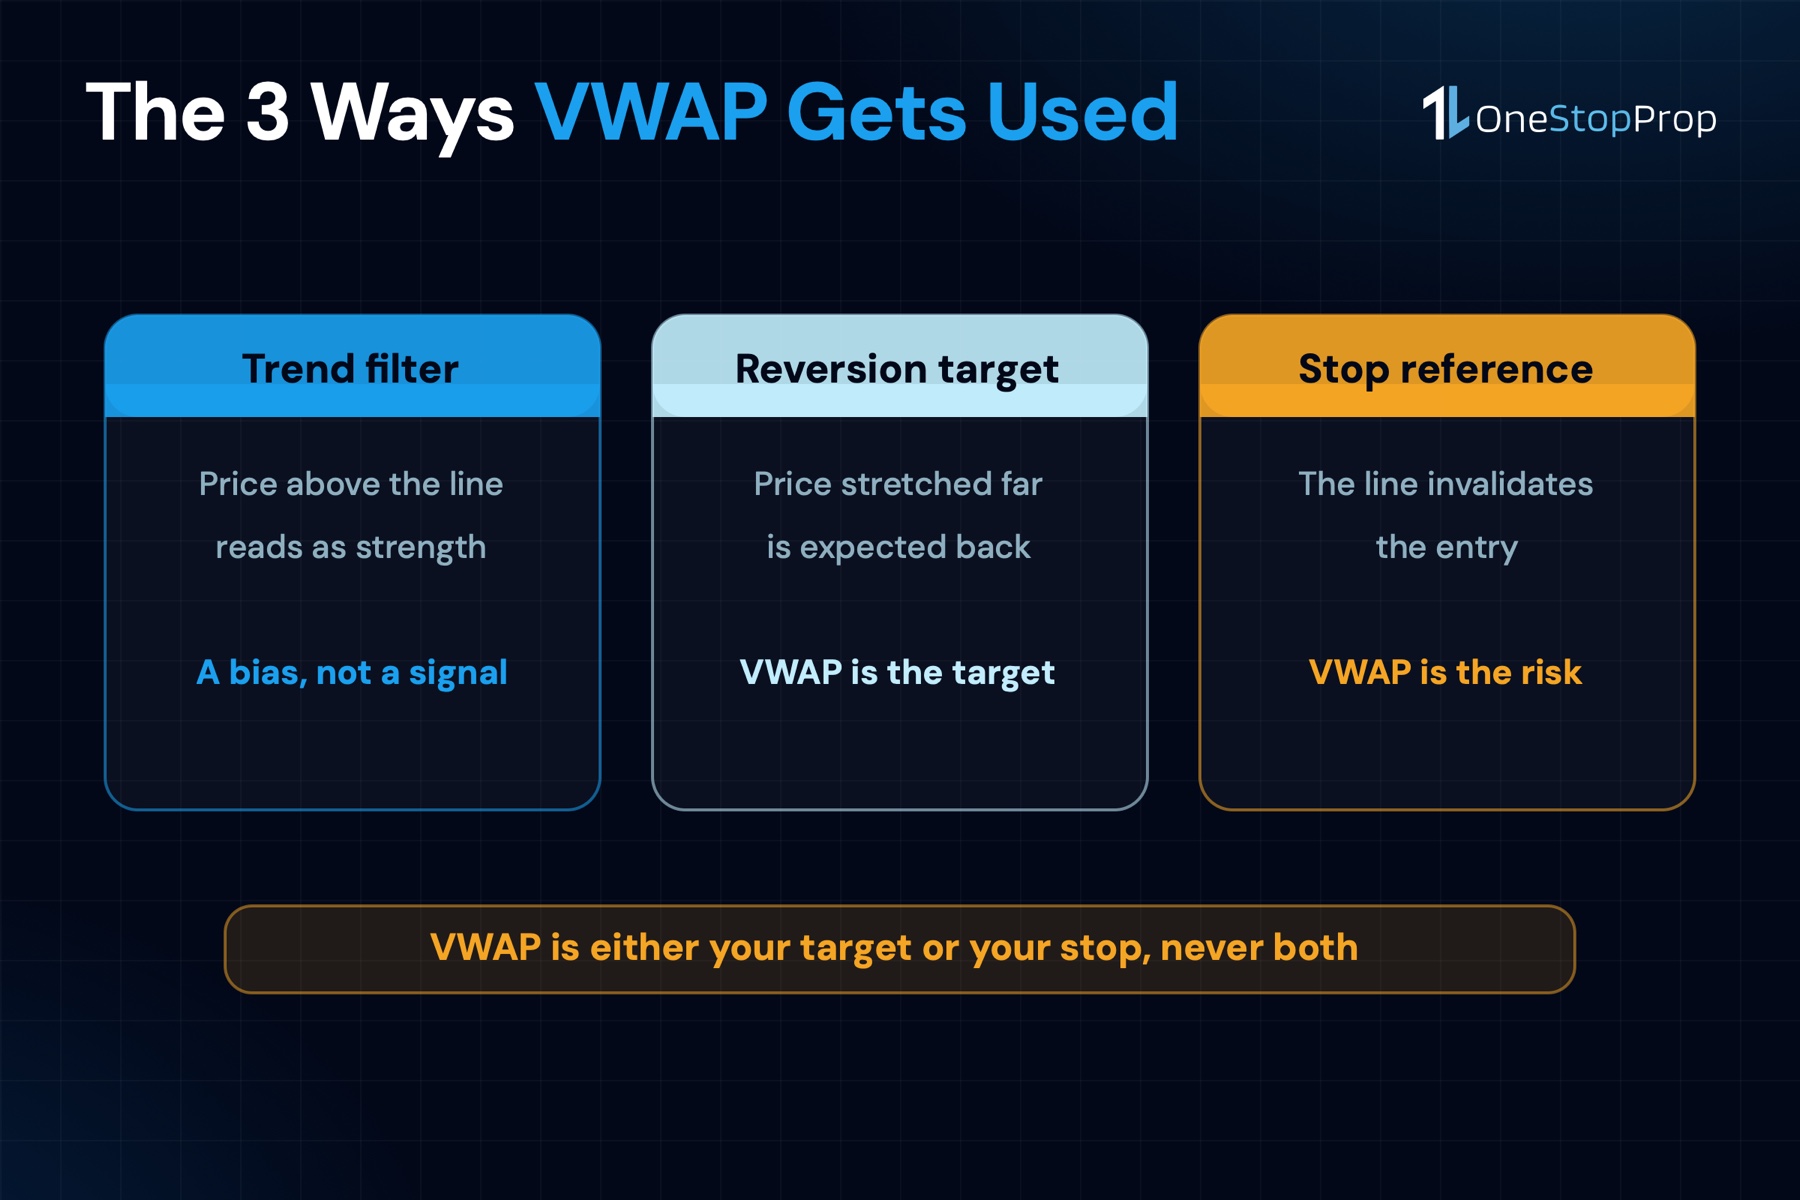
The 3 Ways VWAP Gets Used
As a trend filter. Price above VWAP means the average buyer today is in profit, which traders read as strength. It is a bias, not a signal.
As a mean reversion target. Price stretched far from VWAP is expected to come back toward it. The trade is the return, and VWAP is the target rather than the stop.
As a stop reference. Price reclaims VWAP, you enter, and the line becomes the level that invalidates the trade. This is the use that interacts with the loss limit, because here VWAP defines your risk.
Those 3 are not compatible on the same trade. VWAP is either your target or your stop, and deciding which before you enter is most of the discipline.
Sizing the Trade From the VWAP Distance
Here is the whole method, and it is 1 division.
Take your dollar risk for the trade. On a $100K account at 0.5% per trade that is $500. Measure the distance from your entry to VWAP in dollars. Divide.
| Distance to VWAP | Shares at $500 of risk |
|---|---|
| $0.25 | 2,000 |
| $0.50 | 1,000 |
| $1.00 | 500 |
| $2.00 | 250 |
Read the table in the other direction and the lesson is sharper. The trade that lets you take 2,000 shares is not the better trade. It is the trade where VWAP happens to be close, which is usually the trade with the least room to be right.
Where the Daily Loss Limit Comes In
Every stop you place at VWAP is a withdrawal from the same account budget.
Risking 0.5% per trade, a 4% daily loss limit on 1 Step and 2 Step absorbs 8 consecutive stops before the account is gone. On Instant the limit is 2%, so the same 0.5% risk absorbs 4.
Raise the risk to 1% and those numbers halve: 4 and 2. Reaching the limit does not pause the day, it ends the account, which is why the number of VWAP trades you can afford is a decision you make before the first one.
VWAP in the First 30 Minutes
The opening is where VWAP is least stable and where most traders reach for it hardest.
Cumulative volume is small, so each new print carries weight it will never carry again. The line can sit under price, cross above it and cross back inside a few minutes, and none of those crosses mean what the same cross means at noon.
If your plan uses the opening range, treat VWAP as a second opinion rather than the trigger. The opening range breakout gives you a defined level from the session itself; VWAP in those minutes gives you a number that is still being built.
Pro Tip: If you want VWAP to carry a stop in the first 30 minutes, widen the stop and cut the share count to keep the dollar risk identical. The risk stays constant; only the size moves.
Common Mistakes With a VWAP Trading Strategy
Treating VWAP as support
VWAP is an average, not a level where orders are resting. Price trades through it constantly. A stop 1 cent on the other side of it gets taken out by noise.
Sizing off the chart instead of the distance
A setup that looks identical on 2 stocks can carry a $0.20 stop on one and a $1.80 stop on the other. Same chart, 9 times the risk per share.
Using VWAP as both target and stop
If the plan is to revert to VWAP, VWAP cannot also be the invalidation. The trade needs a level on the other side of the entry.
Carrying it overnight
VWAP resets. A position held overnight wakes up to a line that starts from scratch, so the level that justified the trade no longer exists. Positions can be held overnight and over the weekend at OneStopProp, but the VWAP reason for holding them does not survive the open.
Frequently Asked Questions
What is a VWAP trading strategy?
Any plan that uses the volume weighted average price as its reference: as a bias filter, as a target for a reversion trade, or as the level that invalidates an entry. The useful version defines which of the 3 before the trade is placed.
Is VWAP better than a moving average?
They answer different questions. A moving average smooths price over a fixed number of bars and carries yesterday with it. VWAP weights by volume and resets each session, so it describes today only.
What time frame does VWAP work on?
VWAP is computed from the session open regardless of the chart time frame, so the line is the same on a 1 minute and a 5 minute chart. The time frame changes what you see around it, not the line.
Can I use VWAP on a prop firm account?
Yes. Execution at OneStopProp runs on Match-Trader with TradingView charts inside it, and VWAP is a standard indicator in those charts. What the account rules govern is risk and payouts, not the analysis you do before the entry.
How many VWAP trades can I take in a day?
That is set by your risk per trade and the daily loss limit, not by the strategy. At 0.5% per trade the 4% limit on 1 Step and 2 Step absorbs 8 losing trades; the 2% limit on Instant absorbs 4.
Does VWAP work on low volume stocks?
Less reliably. VWAP is weighted by volume, so a thin stock produces a line that a single large print can move. The daily range of the stock is the better first filter.
The Bottom Line
A VWAP trading strategy is not a signal, it is a distance.
The line tells you where the average share traded today. The gap between that line and your entry tells you what you are risking per share. Dividing your dollar risk by that gap tells you the size. And the daily loss limit of your route tells you how many times you get to be wrong before the account is over.
Every one of those is arithmetic you can do before the trade. The chart pattern is the only part that is an opinion.
If you want to run that arithmetic on a funded account, OneStopProp runs 1 Step, 2 Step and Instant routes from $10K to $300K, with TradingView charts inside Match-Trader and the daily loss limit of each route published before you pay.
Sources
- Funded Account Trading: How It Works, OneStopProp. Profit targets, daily and total loss limits, and the rules by route. https://onestopprop.com/funded-account-trading/
- Opening Range Breakout Strategy, OneStopProp. The defined level the first 30 minutes give you, and how to size it. https://onestopprop.com/opening-range-breakout-strategy/
- Most Volatile Stocks to Day Trade, OneStopProp. Average daily range measured across the stocks available to trade. https://onestopprop.com/most-volatile-stocks-day-trade/
- Risk Reward Ratio for Stock Traders, OneStopProp. How stop distance and position size decide whether a strategy clears its target. https://onestopprop.com/risk-reward-ratio-stock-traders/
- Trading Information, NYSE. Session hours, which is the window VWAP is computed over. https://www.nyse.com/markets/nyse/trading-info
- Day Trading, Investor.gov, U.S. Securities and Exchange Commission. What day trading is and the risk that comes with it. https://www.investor.gov/introduction-investing/investing-basics/glossary/day-trading