The bull flag pattern is a fast rise, a short pause that drifts sideways or slightly down, and a break above the pause. Traders like it because it has a clean stop and a target they can calculate before the entry. On a funded account that is exactly the kind of setup worth keeping, as long as the numbers that come with it are the real ones and not the ones in the textbook.
So this guide measured them. Every daily chart of the 155 U.S. stocks on OneStopProp’s instrument list was scanned for bull flags over the last 12 months, with a fixed definition, and the breakouts were followed for 10 sessions. The result is 325 flags, and what they did is in the tables below.
Then there are 2 real examples with dates and prices, and the arithmetic for sizing a flag inside a daily loss limit.
Key Takeaways
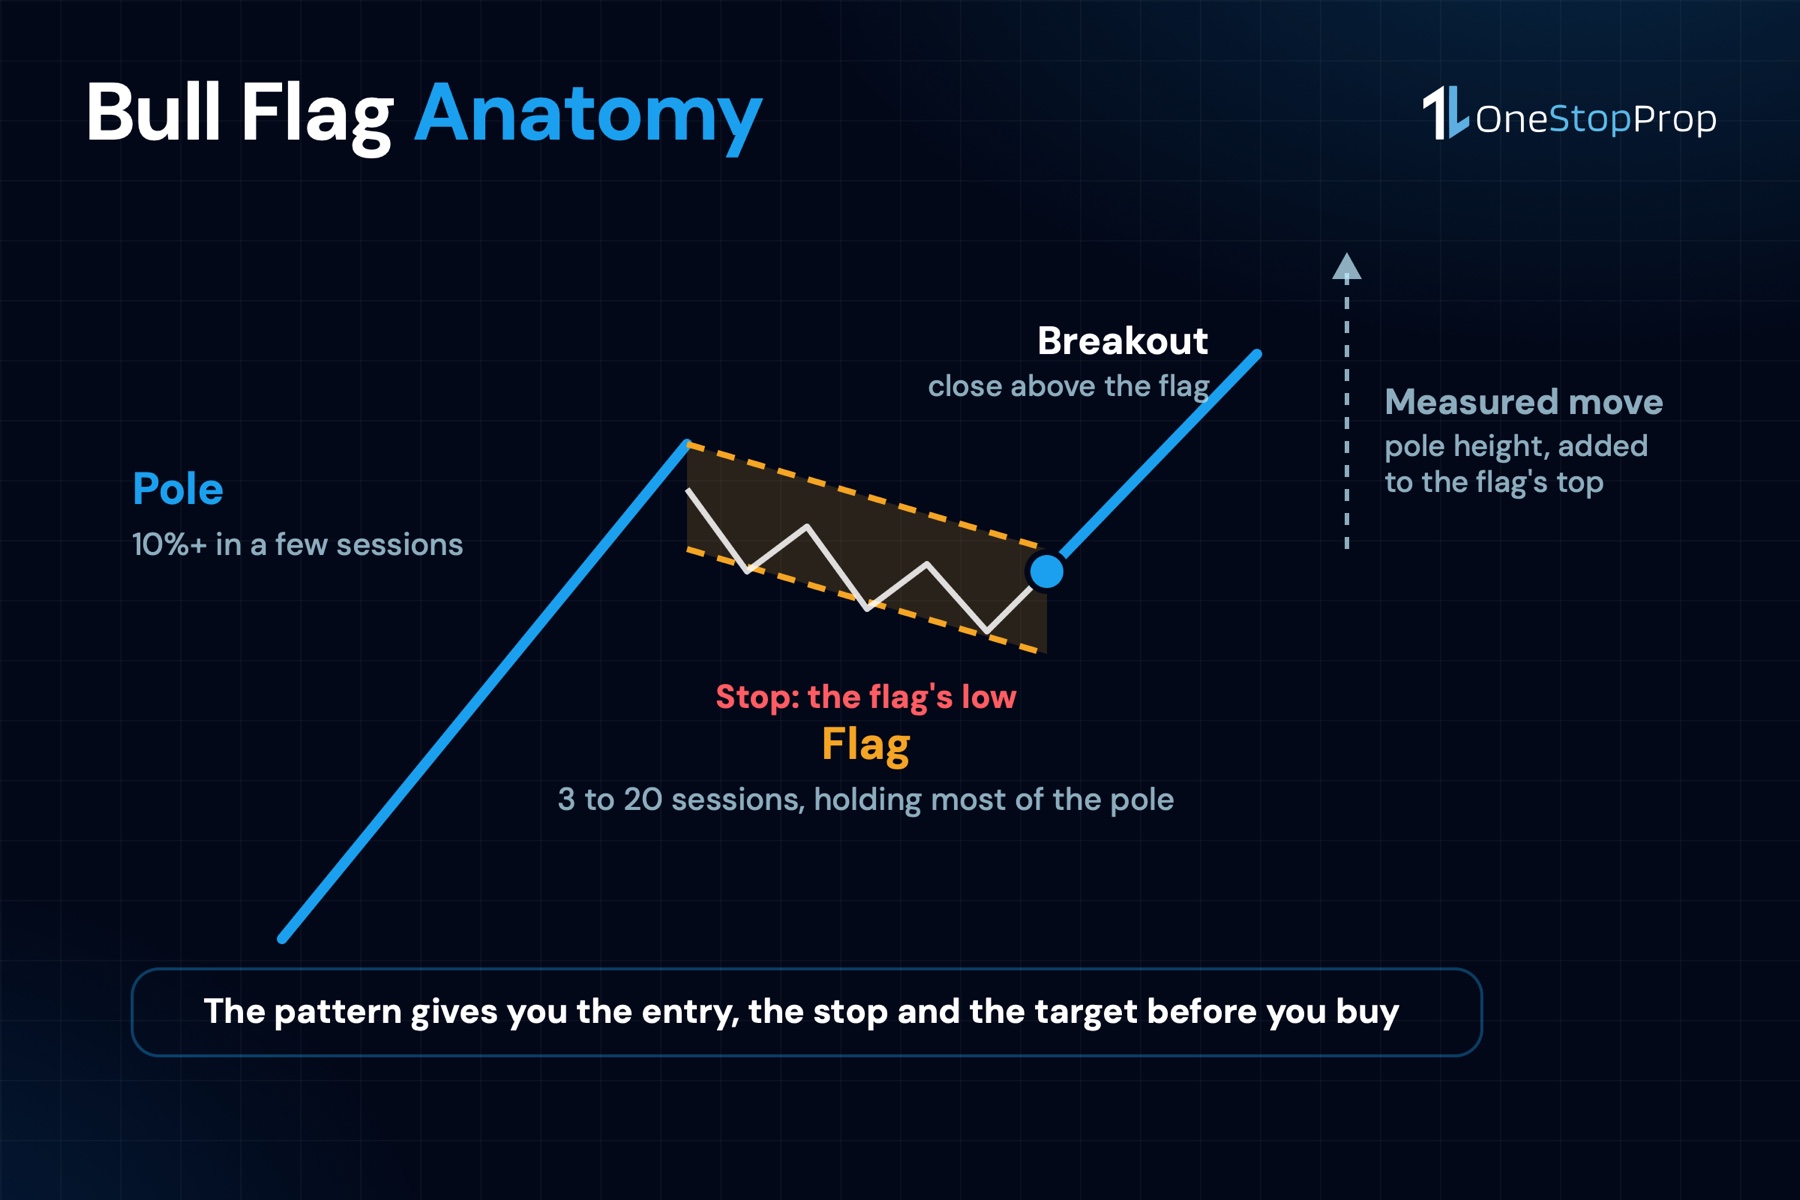
- A bull flag pattern is 3 parts: a pole (a rise of 10% or more in a few sessions), a flag (3 to 20 sessions that hold most of the pole) and a breakout (a close above the flag’s high).
- The measured move is optimistic. Of 325 flags on OneStopProp’s stock list in the last year, 16% reached the full pole height above the flag within 10 sessions. 34% gained at least 1 times the risk, and 31% traded below the flag’s low.
- The stop is the flag’s low. That price is known before the entry, which makes the share count a formula instead of a guess.
- Tight did not mean better in this sample. Flags that retraced less than half the pole on falling volume reached the measured move 13% of the time; looser ones, 18%. The textbook rule did not hold on this data.
- Take the first R. In the examples below the pattern paid about 1 times the risk and then came back. A plan that waits for the full measured move gives most of it away.
What a Bull Flag Pattern Is
A bull flag pattern is a continuation pattern. The stock has already made a strong move up, pauses, and the pause resolves in the same direction as the move.
The 3 parts have names.
- The pole. A sharp rise, usually over a few sessions, often on rising volume. The steeper and cleaner the pole, the clearer the pattern.
- The flag. A pause after the pole. Price drifts sideways or slightly down inside a narrow range, and volume falls off. On a chart it looks like a small rectangle or a down-sloping channel hanging from the top of the pole.
- The breakout. A close above the top of the flag, ideally on more volume than the flag averaged. That close is the entry.
Thomas Bulkowski, whose catalog of flags is the standard reference on the pattern, puts 2 numbers on it that most guides leave out. Flags are short, under 3 weeks; anything longer is a rectangle or a channel. And volume trends down during the flag about 74% of the time. Both are part of the definition, not decoration.
He also publishes the uncomfortable number: in his sample, 46% of upward breakouts reached the measured price target, and the break-even failure rate was 44%. The pattern is real. It is not a guarantee of anything.
How to Identify a Bull Flag Pattern
This is the definition used in the scan below, written as 5 checks. If a chart fails any of them, it is not a bull flag for the purposes of this guide.
- The pole: a rise of at least 10% from a low to a high within 10 sessions, with the high being the highest point of the last 10 sessions.
- The flag: 3 to 20 sessions after the pole’s high, in which no session trades more than 0.3% above that high.
- The retrace: the flag’s low gives back less than 62% of the pole. A pause that gives back more than that is a reversal, not a flag.
- The volume: the flag’s average volume is lower than the pole’s. Not required by the scan, but tracked, because Bulkowski’s data says it usually is.
- The breakout: the first session after the flag closes above the flag’s high.
Note what is not on the list: trendlines drawn by hand, candle colors, or a feeling that the stock “looks strong”. Each check is a number, which is what lets the pattern be counted instead of argued about.
What 325 Bull Flags Did in the Last Year
The scan covered the 155 U.S. stocks on OneStopProp’s instrument list, daily candles from Nasdaq’s historical data, 12 months to October 23, 2026. It found 325 breakouts that met all 5 checks, and followed each one for 10 sessions after the breakout close.
3 outcomes were measured, and they can overlap.
| Outcome within 10 sessions | Flags | Share |
|---|---|---|
| Reached the measured move (flag high plus pole height) | 52 of 325 | 16% |
| Gained at least 1R (breakout close plus the distance to the flag’s low) | 111 of 325 | 34% |
| Traded below the flag’s low (the stop) | 101 of 325 | 31% |
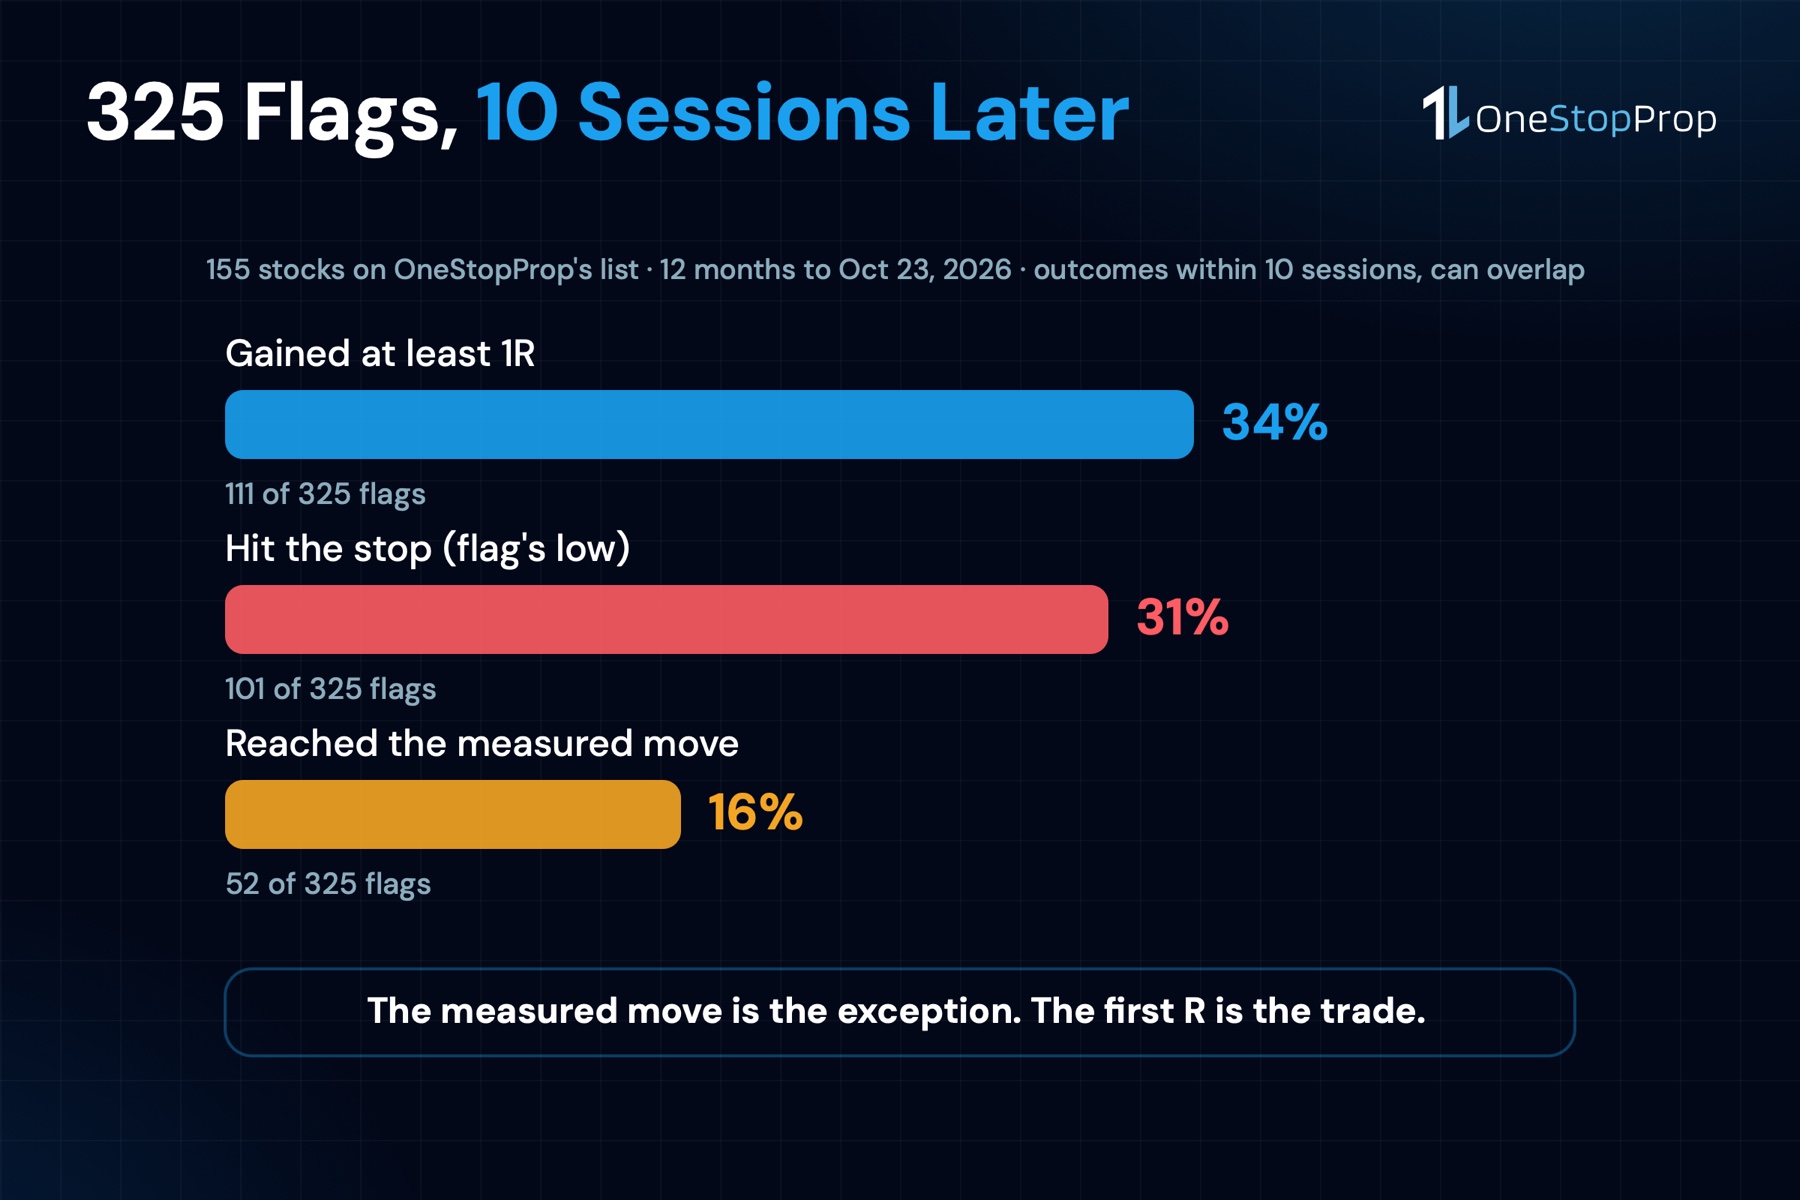
A few things to read out of that.
The measured move is the exception. About 1 flag in 6 got there inside 10 sessions. Bulkowski’s 46% is over a longer horizon and a hand-picked sample; on a mechanical scan of a stock list, the number is lower. A plan that only takes profit at the full target is a plan that usually does not take profit.
1R is a coin flip, slightly in your favour. 34% of breakouts gained the distance from the entry to the stop before 31% lost it. That edge exists, and it is thin, which is why the sizing section matters more than the pattern.
Tight flags were not better here. The sample was split into tight flags, with a retrace under 50% and flag volume below 90% of pole volume, and loose ones. The tight group reached the measured move 13% of the time and hit the stop 36% of the time; the loose group, 18% and 27%. That is the opposite of the usual advice, and it is what this data says.
The median flag in the sample had a 16% pole, lasted 5 sessions and retraced 42% of the pole.
Pro Tip: before trading any pattern on a funded account, run the same count on the stocks you actually trade. The numbers that matter are the ones for your list and your timeframe, and the scan above took 1 afternoon.
A Real Bull Flag: Alibaba, July 2026
Here is one of the cleaner flags in the sample, with every number from the daily data.
- Pole: BABA rose from a low of $96.37 on July 6, 2026 to a high of $121.86 on July 20, a 26.4% move in 10 sessions.
- Flag: 8 sessions, from July 21 to July 30. High $119.45, low $111.66, which is a 40% retrace of the pole. Average volume in the flag was 55% of the pole’s.
- Breakout: July 31, close $122.25, on 2.1 times the flag’s average volume.
- Next 10 sessions: high $132.57, low $121.45. The stock never traded below the breakout close.
- Measured move: flag high plus pole height, $119.45 plus $25.49, which is $144.94. Not reached.
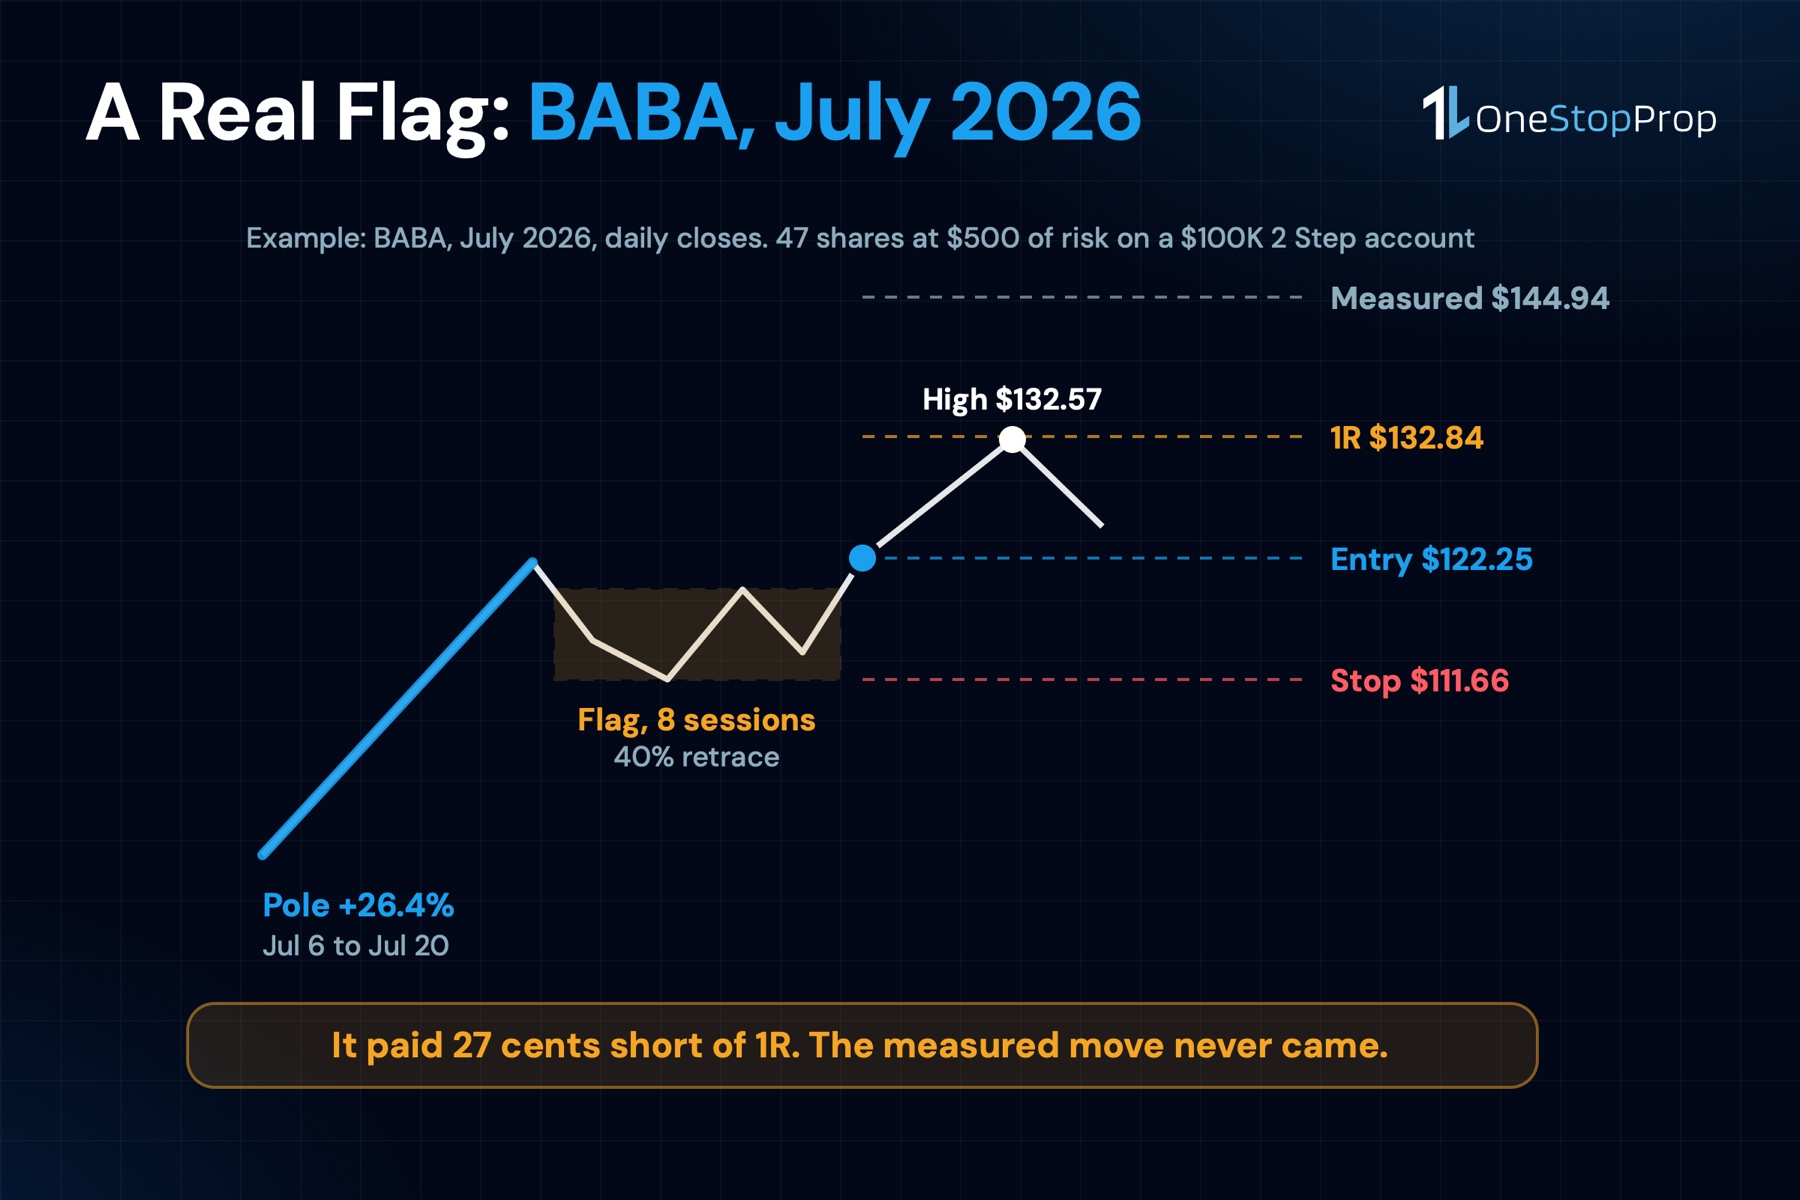
Now the trade, on a $100K 2 Step account with a 0.5% risk per trade, which is $500.
- Entry at the breakout close, $122.25.
- Stop below the flag’s low, $111.66. Distance $10.59.
- Shares: $500 divided by $10.59, which is 47 shares, about $5,746 of stock.
- 1R target: entry plus $10.59, which is $132.84. The high of the next 10 sessions was $132.57, 27 cents short.
- Measured move target: $144.94. Never came close.
So a textbook flag, on a clean breakout with volume, paid almost exactly 1R at its best and nothing at the full target. That is not a failure of the pattern. It is what the pattern usually does, and the plan has to be written for it.
A Second Example: Palantir, October 2026
PLTR built a flag in late September. Pole from $164.55 on September 10 to $194.68 on September 24, an 18.3% rise. Flag of 9 sessions, high $194.78, low $184.81, a 33% retrace on 67% of the pole’s volume. Breakout on October 8 with a close at $198.78 on 2.4 times the flag’s volume.
Within the next 10 sessions the stock reached $212.94, which is 1.01R on a $13.97 stop distance. And then it traded down to $184.45, below the flag’s low.
Both things happened inside 10 sessions. A trader who took profit at 1R was paid. A trader who held for the measured move at $224.91 watched the gain disappear and the stop fill. Same pattern, same entry, opposite outcomes, decided entirely by the exit rule.
How to Trade a Bull Flag Pattern on a Funded Account
The pattern supplies 3 prices. The account supplies the fourth number, and the 4 have to agree before the order goes in.
1. Entry. The breakout close, or the next session’s open if you do not trade the close. Chasing an entry 3% above the flag’s high moves the stop distance and ruins the sizing.
2. Stop. Below the flag’s low. This is the one price that invalidates the pattern: if the stock is back inside the flag’s range, the breakout did not happen.
3. Size. Risk per trade divided by the distance from entry to stop. On a $100K 1 Step or 2 Step account, 0.5% is $500; on Instant, where the daily limit is 2% rather than 4%, the same proportion is $250. The formula and the reasons for it are in the trading plan template.
4. Target. 1R first, with the measured move as a stretch for part of the position if you scale out. On the data above, 1R was hit about twice as often as the measured move.
5. The daily limit check. 3 flags that fail in a row at $500 each are $1,500, which fits inside a $2,000 personal daily stop and well inside the $4,000 limit of a $100K 1 Step or 2 Step account. At 1.5% risk, the same 3 failures are $4,500 and the account is gone. The risk reward ratio guide has the win rates each ratio needs; a 34% rate at 1R needs more than 1:1 to be worth taking, which is the case for scaling part of the position toward the measured move.
6. The clock. Most flags in the sample resolved inside the first few sessions. A flag that has not moved in 5 sessions after the breakout is not building energy; it is a position tying up risk.
Bull Flag vs Bear Flag
A bear flag pattern is the mirror image: a sharp drop, a pause that drifts sideways or slightly up, and a break below the pause. Same 5 checks, inverted, and the stop goes above the flag’s high.
On a funded account the bear flag is a short, and a short carries the gap risk that the how to short a stock guide covers. The pattern is symmetrical; the risk is not.
Common Mistakes With the Bull Flag Pattern
Calling a retrace a flag
A pause that gives back 70% of the pole is not a flag. It is the market changing its mind. Check 3 exists because this is the most common way the pattern gets misread.
Entering inside the flag
Buying the dip inside the flag feels cheaper and has no defined invalidation. The breakout close is the only entry the pattern defines, and the only one that lets the stop sit at a price that means something.
Sizing for the measured move
A trader who sizes for a $22 target and gets a $10 move has a position that is too large for the outcome that actually happens 2 times out of 3. Size from the stop, never from the target.
Holding through the first R
The second example is the whole lesson. 1R came and went, and the stop filled anyway. A rule that takes at least part of the position off at 1R is the difference between those 2 traders.
Trading the pattern on names that gap
A flag in a stock that reports earnings next week is a flag with a hole in it. The 5 minute news window on a funded account exists for that reason, and a flag’s stop does nothing during a halt or a gap, as the trading halts guide shows.
Frequently Asked Questions
What is a bull flag pattern?
A continuation pattern with 3 parts: a sharp rise (the pole), a short pause that keeps most of the rise (the flag), and a close above the pause (the breakout). The entry is the breakout and the stop is the flag’s low.
How reliable is the bull flag pattern?
On 325 flags across OneStopProp’s 155 stocks in the last year, 34% gained at least 1R within 10 sessions, 16% reached the full measured move and 31% hit the stop. Bulkowski’s longer-horizon sample puts the measured target at 46% and the break-even failure rate at 44%.
How long does a bull flag last?
Under 3 weeks by definition. In this sample the median flag lasted 5 sessions, and most breakouts resolved, up or down, within the first few sessions after the close above the flag.
What is the measured move on a bull flag?
The height of the pole, added to the top of the flag. On Alibaba’s July 2026 flag that was $119.45 plus $25.49, or $144.94. It is a stretch target: about 1 flag in 6 reached it within 10 sessions.
What is the difference between a bull flag and a bear flag?
A bear flag is the inverted version: a sharp drop, a pause, and a break below it. The stop goes above the flag’s high, and on a funded account the trade is a short, with the gap risk a short carries.
Can I trade the bull flag pattern on a funded account?
Yes, and it fits well, because the stop is defined before the entry. Size from the distance to the flag’s low, keep risk per trade at a fraction of the daily limit, and take at least part of the position off at 1R.
The Bottom Line
The bull flag pattern is worth trading because it tells you the stop before you enter. It is not worth trading for the measured move, because on real data that target is the exception.
Count it on your own list, size from the flag’s low, take the first R, and the pattern becomes a repeatable piece of a plan instead of a picture from a textbook.
If you want to run those numbers on an account where the daily limit is already written down, get a funded account at OneStopProp: 1 Step, 2 Step or Instant, from $10K to $300K, with U.S. stock CFDs on the same instrument list this scan used and TradingView charts inside the platform.
Sources
- Flags, Bulkowski’s ThePatternSite.com. The identification guidelines, the under-3-weeks rule, the volume trend, the 46% measured-target rate and the 44% break-even failure rate. https://thepatternsite.com/flags.html
- BABA Historical Data, Nasdaq. The daily prices and volume behind the Alibaba example; the same source was used for the scan of all 155 stocks. https://www.nasdaq.com/market-activity/stocks/baba/historical
- Day Trading: Your Dollars at Risk, U.S. Securities and Exchange Commission. The regulator’s summary of short-term trading risk. https://www.sec.gov/investor/pubs/daytips.htm
- What Instruments Can I Trade?, OneStopProp Help Center. The U.S. stock CFD list the scan covered. https://help.onestopprop.com/faq/what-instruments-can-i-trade/
- What is the Maximum Daily Loss?, OneStopProp Help Center. The 4% daily limit on 1 Step and 2 Step and 2% on Instant. https://help.onestopprop.com/faq/what-is-the-maximum-daily-loss/
- Opening Range Breakout Strategy, OneStopProp. The other breakout setup sized the same way. https://onestopprop.com/opening-range-breakout-strategy/