The search “nvidia earnings date” has 1 answer this quarter: Tuesday, November 17, 2026, after the close. Nvidia will publish its third-quarter fiscal 2027 results at approximately 1:20 PM Pacific, which is 4:20 PM Eastern, and hold the call at 2 PM Pacific. The company confirmed the date twice, on October 28 and again on November 12, the day its CEO resigned.
That second confirmation is why this report is not a routine one. NVDA closed at $162.85 on Friday, November 13, 31.9% below its October 6 closing high of $239.24, and the quarter will be presented by Colette Kress, the CFO who became interim CEO 5 days before the release. The stock has 1 headline behind it and 1 in front of it, with 2 sessions left between them.
This guide does not guess what the numbers will say. It measures what NVDA did the day after each of its last 12 earnings reports, from November 2023 to August 2026, using Nasdaq’s daily data: how big the opening gap was, which way it went, how wide the day ran, and what happened a week later. Then it puts those numbers against the rules of a funded account, where the 5-minute news window and the daily loss limit decide what you can hold through Tuesday night.
Key Takeaways
- The Nvidia earnings date is Tuesday, November 17, 2026, after the close. Results at about 1:20 PM PT (4:20 PM ET), call at 2 PM PT (5 PM ET), per Nvidia’s October 28 and November 12 releases. The first price a stock trader can act on is Wednesday’s 9:30 AM ET open.
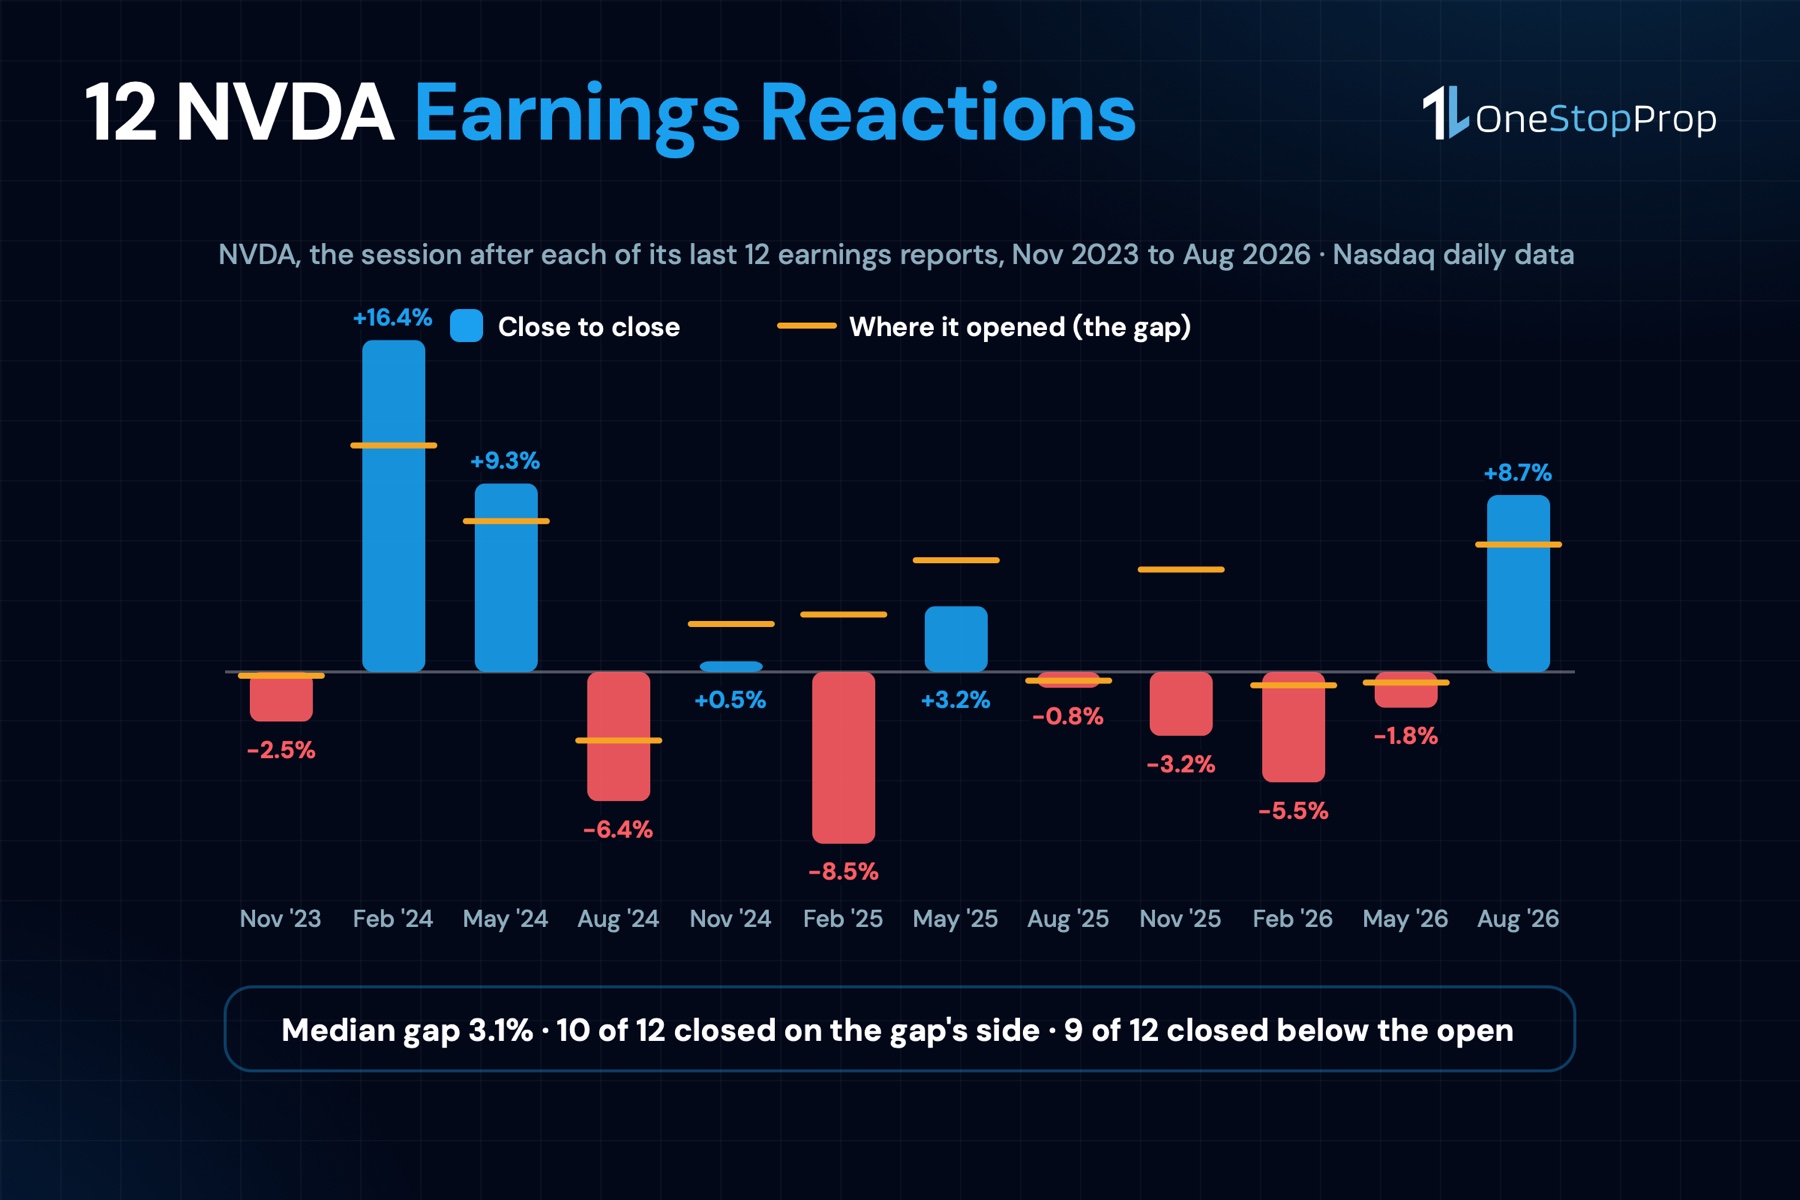
- The median earnings gap was 3.1%. Across the last 12 reports NVDA opened a median 3.1% away from the pre-report close, 7 times up and 5 times down, with the largest gap at 11.2% (February 2024) and the smallest at 0.2%. On a normal day the median gap is 1.0%.
- The gap was most of the move, and then the day sold off. 10 of 12 reaction days closed on the gap’s side, but 9 of 12 closed below their own open. 4 of the 7 upward gaps faded during the session, and all 5 downward gaps kept falling.
- The range was 2.3 times a normal day. The median true range of the reaction day was 7.7% of the prior close, against 3.3% on the other 754 sessions, on 1.7 times normal volume.
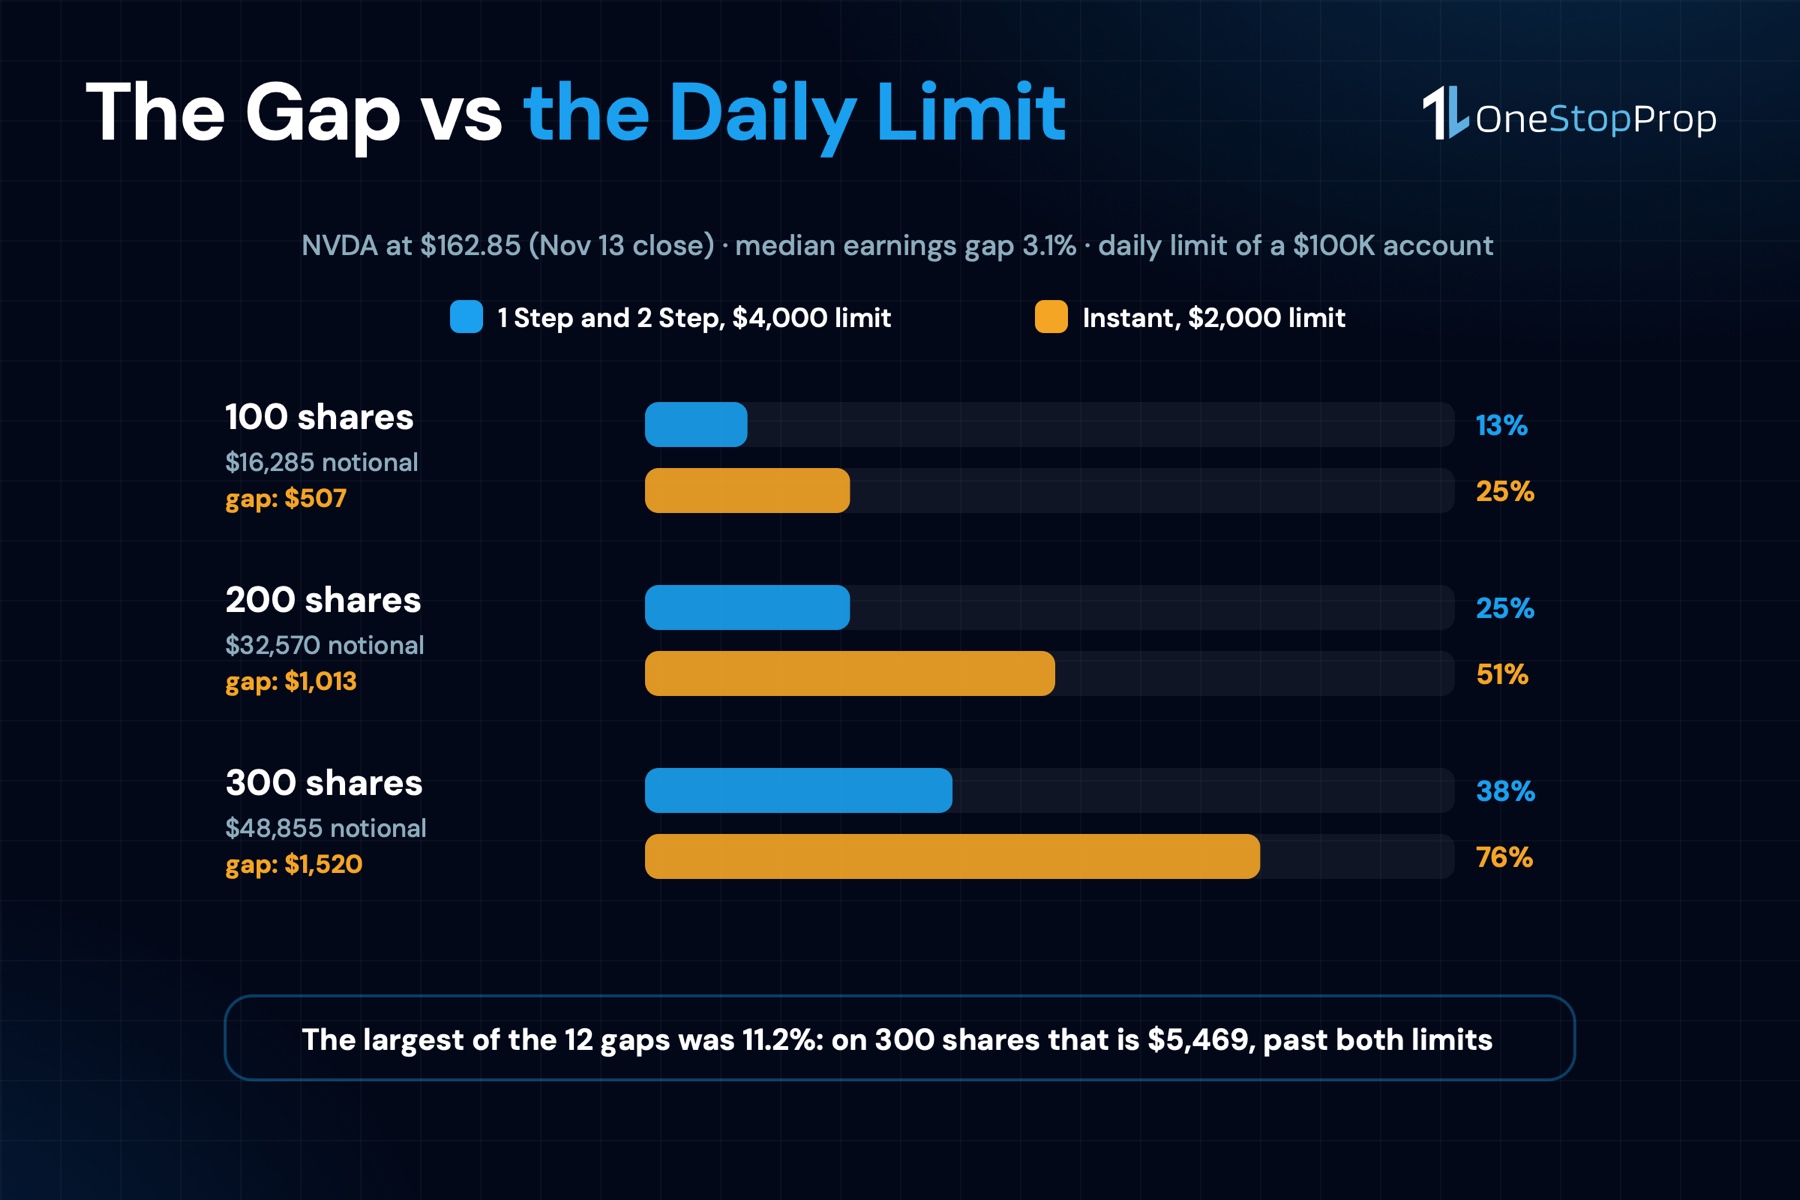
- On a $100K 1 Step or 2 Step account the daily limit is $4,000. A 3.1% gap on 300 NVDA shares at $162.85 is $1,520, which is 38% of that limit before the first trade of the day, and 76% of the $2,000 limit on a $100K Instant account.
When Is the Nvidia Earnings Date, and Why It Was Confirmed Twice
Nvidia set the date on October 28, 2026, in a short release titled NVIDIA Sets Conference Call for Third-Quarter Financial Results: a call on Tuesday, November 17, at 2 PM PT (5 PM ET), for the quarter that ended October 25, 2026, with the results themselves published at approximately 1:20 PM PT and written CFO commentary posted right after.
On November 12 the company repeated the date in the release announcing that Jensen Huang had resigned as president, CEO and director, effective immediately. The same release named Colette Kress, CFO since September 2013, as interim CEO while keeping the CFO role, and Harvey C. Jones as the board’s first-ever chair. Its last paragraph says the third-quarter report will go ahead on November 17 “as previously scheduled.”
The market reaction to that release is covered in our piece on the Nvidia CEO resignation. For this article the relevant part is the calendar. A stock that gapped 13% lower on Thursday morning and closed the day down 4.3% had 3 regular sessions before its next scheduled catalyst, and the first of them is already in the books.
Friday, November 13 was a failed bounce. NVDA opened at $169.91, up 2.2% from Thursday’s close, printed its high of $170.00 early, and sold off to a low of $158.39, 4.7% below the prior close, before closing at $162.85, down 2.0% on the day. Open to close the session lost 4.2%, on 366 million shares, 1.9 times its 20-day average and under half of Thursday’s 748 million.
That leaves the stock 31.9% below its October 6 closing high and 21.2% below its November 3 close, with 2 regular sessions, Monday and Tuesday, before the report. In Monday’s pre-market, at 7:50 AM ET, Nasdaq quoted NVDA at $157.89, another 3.0% lower. That is a quote and not a close, so the position table below is sized to Friday’s close.
The Nasdaq regular session runs 9:30 AM to 4:00 PM ET, per the exchange’s trading hours page. A 4:20 PM ET release lands 20 minutes after the cash close. Whatever the numbers say, the first regular-session price that reflects them is Wednesday’s open, and that is the price every row in the next section measures.
How the 12 Reactions Were Measured
The 12 report dates come from Nvidia’s own results releases on its newsroom, from the Q3 fiscal 2024 report on November 21, 2023 to the Q2 fiscal 2027 report on August 26, 2026. Every one of those releases schedules the call for “today at 2 p.m. Pacific time,” so every report landed after the close and the reaction day is the next session.
The prices are Nasdaq’s daily open, high, low, close and volume for NVDA, split-adjusted, from September 2023 to November 13, 2026, from its historical data page. For each report the script computed, on the next session:
- The gap: the open against the pre-report close.
- The move: the close against the pre-report close.
- Open to close: the part of the day a trader who was flat overnight can actually trade.
- The true range: the day’s high-to-low span, extended to the previous close if the gap left it outside, as a percentage of that close.
- Relative volume: the day’s volume divided by the average of the 20 sessions through the report day. The relative volume guide explains the ratio.
- 5 sessions later: the close 5 sessions after the report day against the pre-report close.
The “normal day” baseline is every other session from the first report’s 20-day lookback through November 12, 754 of them. Friday, November 13 is used only for the position table. All of it is in the data file that accompanies this article.
What NVDA Did the Day After Its Last 12 Earnings Reports
| Report date | Quarter | Gap at the open | Close to close | Open to close | True range | Volume vs 20-day | 5 sessions later |
|---|---|---|---|---|---|---|---|
| Nov 21, 2023 | Q3 FY2024 | -0.2% | -2.5% | -2.3% | 5.3% | 2.1x | -3.6% |
| Feb 21, 2024 | Q4 FY2024 | +11.2% | +16.4% | +4.7% | 16.5% | 1.7x | +15.1% |
| May 22, 2024 | Q1 FY2025 | +7.5% | +9.3% | +1.7% | 12.0% | 2.1x | +16.4% |
| Aug 28, 2024 | Q2 FY2025 | -3.4% | -6.4% | -3.1% | 7.1% | 1.2x | -14.6% |
| Nov 20, 2024 | Q3 FY2025 | +2.4% | +0.5% | -1.8% | 8.4% | 1.9x | -7.2% |
| Feb 26, 2025 | Q4 FY2025 | +2.8% | -8.5% | -11.0% | 11.4% | 1.7x | -10.6% |
| May 28, 2025 | Q1 FY2026 | +5.5% | +3.2% | -2.1% | 6.4% | 1.7x | +5.3% |
| Aug 27, 2025 | Q2 FY2026 | -0.4% | -0.8% | -0.4% | 4.4% | 1.7x | -5.5% |
| Nov 19, 2025 | Q3 FY2026 | +5.1% | -3.2% | -7.8% | 8.7% | 1.7x | -3.4% |
| Feb 25, 2026 | Q4 FY2026 | -0.7% | -5.5% | -4.8% | 5.8% | 2.0x | -6.4% |
| May 20, 2026 | Q1 FY2027 | -0.5% | -1.8% | -1.3% | 4.2% | 1.3x | -4.1% |
| Aug 26, 2026 | Q2 FY2027 | +6.3% | +8.7% | +2.3% | 9.9% | 2.6x | +7.0% |
Gap and close-to-close are measured from the close on the report day. Open-to-close is measured from the reaction day’s open. 5 sessions later is the close 5 sessions after the report day, against the report-day close.
4 Things the Table Says
The gap is the event. The median absolute gap was 3.1%, and the median close-to-close move was 4.4%, so on the median day 61% of the whole move was already on the screen at 9:30 AM. On a normal day NVDA gaps a median 1.0%, and only 5.6% of normal sessions gap 3.1% or more. The earnings date turns a 1-in-18 day into the expected day.
Direction held from the gap to the close, mostly. 10 of 12 reaction days closed on the same side of the prior close as they opened. The 2 exceptions were both upward gaps that collapsed: February 27, 2025 opened 2.8% up and closed 8.5% down, and November 20, 2025 opened 5.1% up and closed 3.2% down.
But the session itself leaned down, from the open. 9 of 12 reaction days closed below their own open, with a median open-to-close of 2.0% down. 4 of the 7 upward gaps faded during the day. All 5 downward gaps kept falling. The 3 days that rallied from the open were the 3 biggest upward gaps: February 2024, May 2024 and August 2026. On the median reaction day the stock traded 3.4% below its open at some point and only 2.2% above it.
The range was double and the volume was not. The median true range was 7.7% of the prior close, 2.3 times the 3.3% of a normal day. Volume ran a median 1.7 times the 20-day average, between 1.2 and 2.6 times. The day moves far more than its volume suggests, because much of the move happens in 1 print at the open.
A week later, the stock was usually lower. 5 sessions after the report, NVDA was above the pre-report close only 4 times in 12, with a median of 3.9% below it. 9 of the 12 were on the gap’s side a week later, so the direction tended to hold and the level tended to sag, including after 3 of the 7 upward gaps.
Trading the nvidia earnings date on a funded account
Nothing in the measurement above is a forecast. What it gives a funded trader is a size: the gap you have to be able to absorb at 9:30 AM Wednesday if you are holding NVDA through the release. 4 rules from the OneStopProp Help Center meet that number head-on, and each applies to the funded stage.
The release is inside the news window. The Help Center’s answer to Is news trading allowed? lists all individual stock earnings reports, including post-market releases, among the restricted events. On funded accounts, all trades must be closed 5 minutes before the release and may not be opened until 5 minutes after. For a 4:20 PM ET release that window is 4:15 to 4:25 PM ET. Traders with the News Trading Allowed Add-On are exempt and may open, hold or close positions through it.
Overnight holds are allowed. The Help Center is 1 sentence long on this: yes, you can hold trades overnight and over weekends. With the Add-On, an NVDA position can go from Tuesday’s session straight into Wednesday’s open. Without it, the position has to be flat before the window and the trade is Wednesday’s session, from the open onward.
The daily loss limit is measured from midnight, and the gap lands inside it. Per What is the Maximum Daily Loss?, the limit is 4% of the initial balance on 1 Step and 2 Step accounts and 2% on Instant, calculated at 12:00 AM EST from the higher of balance or equity. A position carried through the release is marked at that reset, and whatever the gap does at 9:30 AM counts against Wednesday’s limit in full, before you have clicked anything.
Shorting is allowed on every instrument, per Is shorting allowed?, and NVDA is on the U.S. stock CFD list. 5 of the last 12 gaps were down, and all 5 kept falling from the open. The short side of a reaction day is as available as the long side.
Here is the median gap against the daily limit, on a $100K account, with NVDA at its Friday, November 13 close of $162.85.
| Position | Notional | 3.1% gap | Share of the $4,000 limit (1 Step, 2 Step) | Share of the $2,000 limit (Instant) |
|---|---|---|---|---|
| 100 shares | $16,285 | $507 | 13% | 25% |
| 200 shares | $32,570 | $1,013 | 25% | 51% |
| 300 shares | $48,855 | $1,520 | 38% | 76% |
That is the median. The largest of the 12 gaps, 11.2% in February 2024, on the same 3 positions is $1,823, $3,646 and $5,469: 46%, 91% and 137% of the $4,000 limit. On a 1 Step or 2 Step account, 219 shares is where a gap that size uses the entire day’s allowance. On Instant, 100 shares already uses 91% of it.
Pro Tip: before Tuesday’s close, write down 2 dollar figures for any NVDA position you plan to hold through the release: the loss at a 3.1% gap and the loss at an 11.2% gap. If the first number is above half your daily limit, or the second is above the whole of it, the position is sized for a normal day and the earnings date is not one.
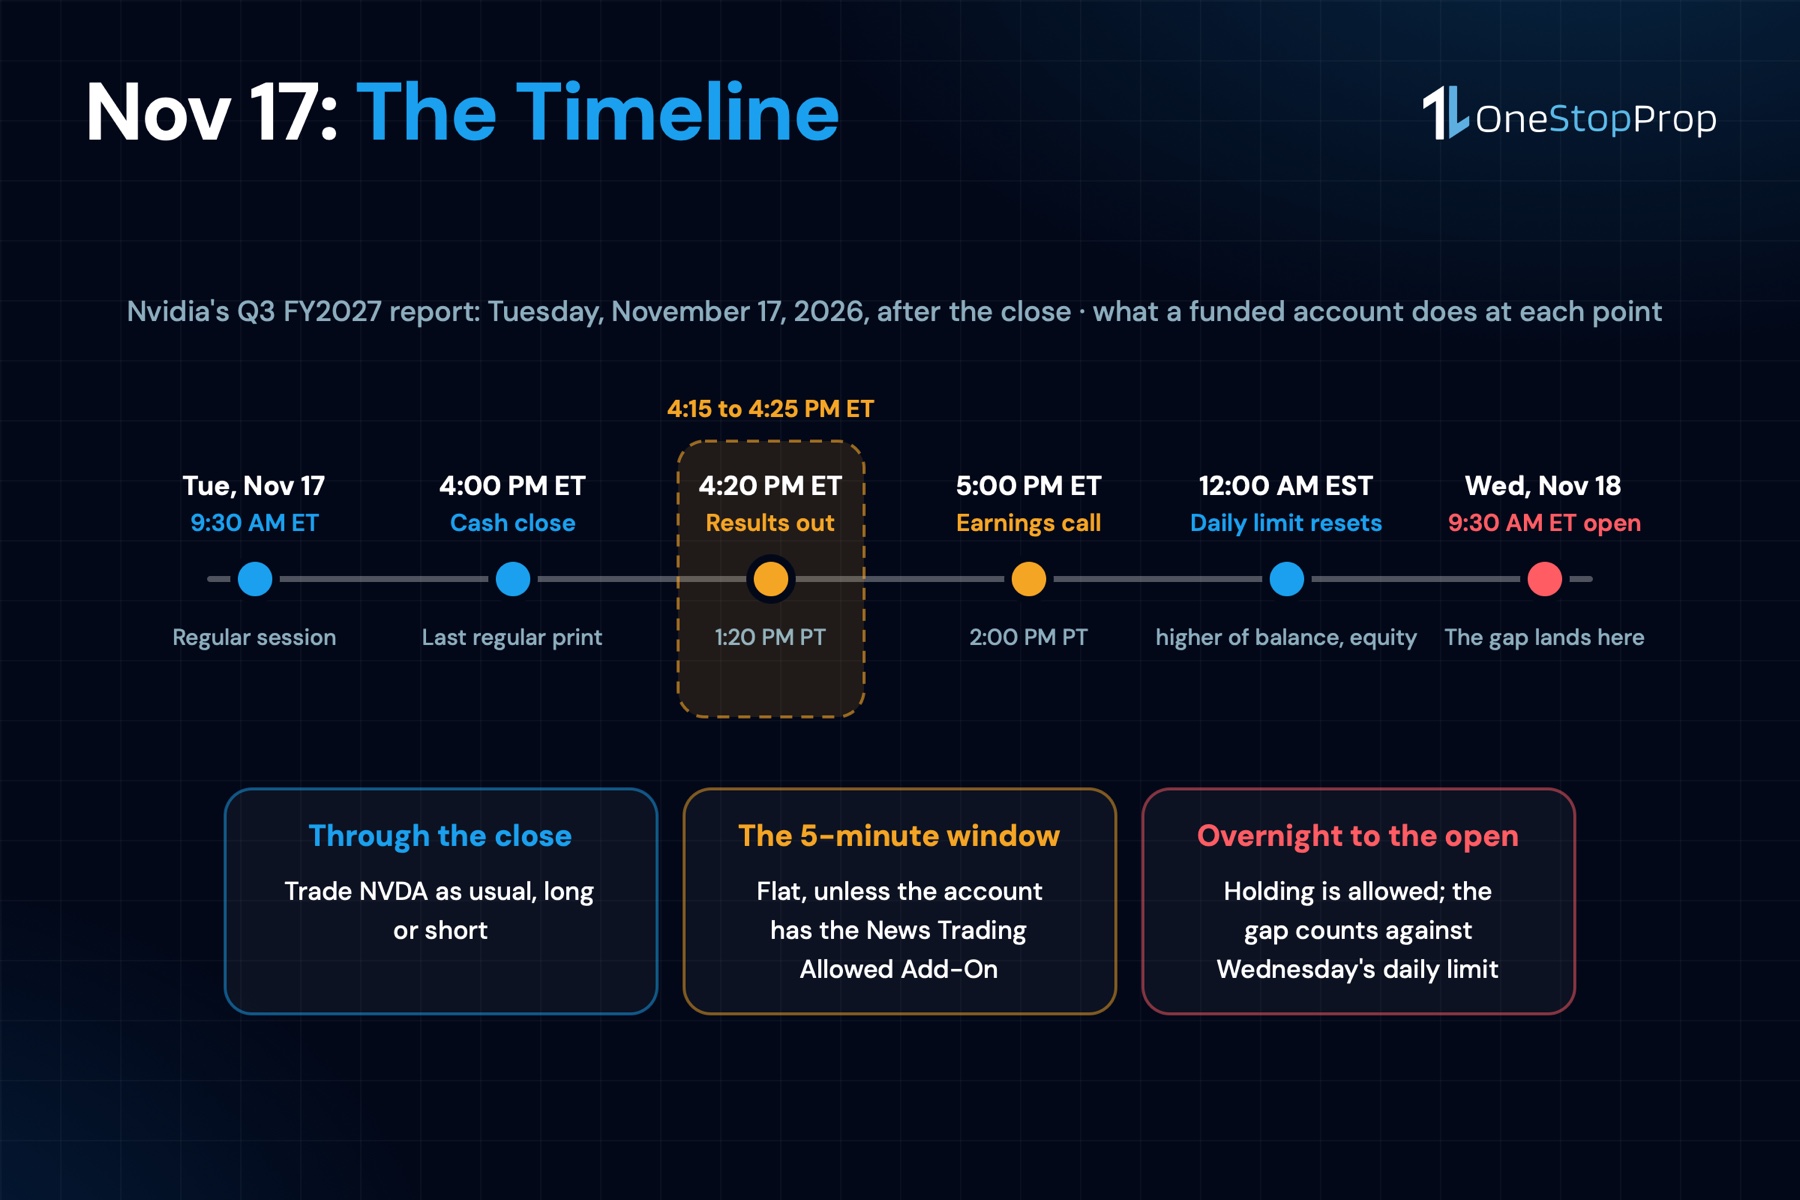
The Hour-by-Hour Plan for November 17 and 18
The timeline below is the same for every funded account. What changes is whether the account carries the Add-On.
Tuesday, 9:30 AM to 4:00 PM ET: the regular session. NVDA trades as usual, long or short, inside the normal rules. There is no restriction on holding or opening positions during the day of the report. The sessions before NVDA’s last 12 reports are not what this article measured, so it makes no claim about them.
4:00 PM ET: the cash close. This is the last regular-session print before the release, and the reference every number in this article is measured from. Without the News Trading Allowed Add-On, this is the practical deadline to be flat in NVDA: the restricted window opens 15 minutes later, after the regular session has ended.
4:15 to 4:25 PM ET: the restricted window. The release is due at approximately 1:20 PM PT, which is 4:20 PM ET. On a funded account without the Add-On, no NVDA position may be open from 5 minutes before to 5 minutes after. With the Add-On, the window does not apply.
5:00 PM ET: the earnings call. 2 PM PT, webcast on Nvidia’s investor site, with written CFO commentary posted right after the results. The after-hours price will move around both. For a daily-candle trader, the only number that matters is where Wednesday opens.
12:00 AM EST: the daily loss limit resets. The account’s limit for Wednesday is set from the higher of balance or equity at that moment, per the Help Center. An open NVDA position carried with the Add-On is marked here, before the gap.
Wednesday, 9:30 AM ET: the gap lands. The median across 12 reports is 3.1%, the largest 11.2%. On the median day, 61% of the whole close-to-close move is in this 1 print. The market order vs limit order guide covers why a market order in the first minute of a day like this fills where the book is thinnest.
2 Ways to Trade It, and 1 Way Not To
Without the Add-On: trade Wednesday’s session, not Tuesday night. The record says the gap takes 61% of the move and the day then leans lower from the open: 9 of 12 closed below where they opened, with a median open-to-close of 2.0% down. That is a session a stock trader can plan for without touching the release. Let the opening range print, size the stop to a 7.7% range day rather than a 3.3% one, and take the side the first 15 to 30 minutes confirm. Shorting is available, and the 5 downward gaps on the list all extended.
With the Add-On: hold through, sized to the table above. The News Trading Allowed Add-On makes the overnight hold legal. The daily limit makes it expensive. A position that would use more than half the limit on the median gap is a bet on the direction of a release, and 2 of the last 12 upward gaps reversed into 8.5% and 3.2% losses by the close. The gap you can survive sets the size; the thesis does not.
Either way: do not buy the gap for the follow-through. The up gaps that paid, February 2024, May 2024 and August 2026, were the 3 largest, and they kept going. The 4 smaller up gaps, between 2.4% and 5.5%, all faded from the open. And a week later the stock was below the pre-report close in 8 of 12 cases. Our guide to trading earnings releases at a prop firm has the general playbook; this is what the playbook looks like on NVDA specifically.
Pro Tip: on a funded account, the stop on Wednesday morning is a range problem before it is a direction problem. The median reaction day traded 3.4% below its open at some point. A stop closer than that on a long is inside the day’s normal noise, and a position sized for a 7.7% range day is 2.3 times smaller than one sized for a 3.3% day.
Common Mistakes Around an NVDA Earnings Date
Treating the pre-market print as the open
The pre-market price after an earnings release and the 9:30 AM ET print are 2 different numbers, and the second one is the one that counts against the daily limit. Size to the regular-session open, not to the after-hours quote.
Holding through the window without the Add-On
The Help Center is explicit: all individual stock earnings reports, including post-market releases, are restricted events on funded accounts. An NVDA position open at 4:20 PM ET on November 17 without the News Trading Allowed Add-On is a rule breach, whichever way the stock goes.
Sizing to a normal day
The median reaction day ran 7.7% from high to low, against 3.3% on a normal day. A stop and a position built for 3.3% are a stop that fills in the noise and a position that is 2.3 times too big.
Buying a modest gap up for the continuation
The 4 upward gaps between 2.4% and 5.5% all closed below their open; 2 of them closed below the prior close. The upward gaps that kept going were the 3 largest. A small gap up on an NVDA earnings date has been a fade more often than a trend.
Confusing the report date with the reaction date
Nvidia reports after the close. The candle that carries the reaction is the next session, so the Nov 17 report shows up on the Nov 18 bar. Every statistic in this article is measured that way, and the date in your journal should be too. The NVDA guide for prop firm traders covers how the stock trades on ordinary days, for comparison.
Frequently Asked Questions
When is the Nvidia earnings date for the third quarter of fiscal 2027?
Tuesday, November 17, 2026, after the close. Nvidia’s October 28 release schedules the results for approximately 1:20 PM PT (4:20 PM ET) and the call for 2 PM PT (5 PM ET), and its November 12 release confirming the CEO transition repeats that the report will go ahead as previously scheduled.
What time does Nvidia report earnings?
About 1:20 PM Pacific, 4:20 PM Eastern, 20 minutes after the Nasdaq regular session closes at 4:00 PM ET. The conference call follows at 2 PM Pacific, 5 PM Eastern. The first regular-session price that reflects the results is the next morning’s 9:30 AM ET open.
How much does NVDA usually move after earnings?
On its last 12 reports, from November 2023 to August 2026, NVDA opened a median 3.1% away from the pre-report close and closed a median 4.4% away, with a median true range of 7.7% for the reaction day. The largest gap was 11.2% up, in February 2024; the largest close-to-close drop was 8.5%, in February 2025.
Can you hold NVDA through earnings on a funded account?
Only with the News Trading Allowed Add-On. Without it, OneStopProp’s funded accounts must be flat from 5 minutes before to 5 minutes after any individual stock earnings release, including post-market ones. Overnight and weekend holds are otherwise allowed, so with the Add-On the position can be carried into the next open.
How does the earnings gap count against the daily loss limit?
The daily limit is 4% of the initial balance on 1 Step and 2 Step accounts, 2% on Instant, measured at 12:00 AM EST from the higher of balance or equity. A position held through the release is marked at that reset, and the gap at 9:30 AM counts against the new day’s limit. On a $100K 1 Step or 2 Step account, a 3.1% gap on 300 NVDA shares at $162.85 is $1,520, 38% of the $4,000 limit.
Is this nvidia earnings date different because of the CEO change?
The date and time are unchanged; the November 12 release says so. What changed is the context: the report will be presented by Colette Kress as interim CEO and CFO, and the stock enters it 31.9% below its October 6 closing high, after a 13% opening drop on November 12 and a failed bounce on November 13 that closed down another 2.0%. The measurement in this article covers the 12 reports before that, so it describes the stock’s earnings behavior, not this quarter’s outcome.
The Bottom Line
The nvidia earnings date is Tuesday, November 17, 2026, at about 4:20 PM ET, and the price that answers it is Wednesday’s 9:30 AM open. Across the last 12 reports that open was a median 3.1% from the prior close, 61% of the day’s whole move, and the day then ran 7.7% high to low and closed below its open 9 times in 12. A week later the stock was below where it started in 8 of 12 cases.
For a funded account the arithmetic comes before the opinion. Without the News Trading Allowed Add-On, the trade is Wednesday’s session, sized to a 7.7% range. With it, the trade is the overnight hold, sized so the 3.1% median gap stays well inside the daily limit and the 11.2% worst case does not end the account. Either way, 300 shares at $162.85 is $1,520 of gap risk on the median day, and that number belongs on paper before Tuesday’s close.
If you want to trade this report with the loss limits already written down and the Add-On a checkbox rather than a guess, start a funded account at OneStopProp: 1 Step, 2 Step or Instant, from $10K to $300K, with NVDA among the U.S. stock CFDs, no time limit on the challenge, and overnight and weekend holds allowed.
Sources
- NVIDIA Sets Conference Call for Third-Quarter Financial Results, NVIDIA Newsroom. The October 28, 2026 release: call on Tuesday, November 17 at 2 PM PT (5 PM ET), results published at approximately 1:20 PM PT, for the quarter ended October 25, 2026. https://nvidianews.nvidia.com/news/nvidia-sets-conference-call-for-third-quarter-financial-results-6928873
- NVIDIA Announces CEO Transition, NVIDIA Newsroom. The November 12, 2026 release: Jensen Huang’s resignation, Colette Kress as interim CEO and CFO, Harvey C. Jones as chair, and the November 17 report reconfirmed at approximately 1:20 PM PT with the call at 2 PM PT. https://nvidianews.nvidia.com/news/nvidia-announces-ceo-transition
- NVIDIA Announces Financial Results for Second Quarter Fiscal 2027, NVIDIA Newsroom. The August 26, 2026 release, the most recent of the 12 report dates used; the other 11, from the Q3 fiscal 2024 release of November 21, 2023 onward, are on the same newsroom and all schedule the call for 2 PM Pacific on the day of the release. https://nvidianews.nvidia.com/news/nvidia-announces-financial-results-for-second-quarter-fiscal-2027
- NVIDIA Corporation (NVDA) Historical Data, Nasdaq. Daily open, high, low, close and volume, split-adjusted, September 2023 to November 13, 2026, used for the 12 reaction days, the normal-day baseline through November 12, the November 13 session and the $162.85 close. The Monday pre-market quote is from Nasdaq’s NVDA quote page at 7:50 AM ET on November 16. https://www.nasdaq.com/market-activity/stocks/nvda/historical
- Trading Hours for the Nasdaq Stock Markets, Nasdaq. Regular session 9:30 AM to 4:00 PM ET, Monday through Friday. https://www.nasdaq.com/stock-market-trading-hours-for-nasdaq
- Is news trading allowed?, OneStopProp Help Center. The 5-minute window before and after restricted events on funded accounts, including all individual stock earnings reports and post-market releases, and the News Trading Allowed Add-On. https://help.onestopprop.com/faq/is-news-trading-allowed/
- Can I hold trades overnight and over weekends?, OneStopProp Help Center. Overnight and weekend holds are allowed. https://help.onestopprop.com/faq/can-i-hold-trades-overnight-and-over-weekends/
- What is the Maximum Daily Loss?, OneStopProp Help Center. 4% of the initial balance on 1 Step and 2 Step, 2% on Instant, measured at 12:00 AM EST from the higher of balance or equity. https://help.onestopprop.com/faq/what-is-the-maximum-daily-loss/
- Is shorting allowed?, OneStopProp Help Center. Shorting is allowed on all instruments, stocks included. https://help.onestopprop.com/faq/is-shorting-allowed/
- What instruments can I trade?, OneStopProp Help Center. The U.S. stock CFD list that includes NVDA. https://help.onestopprop.com/faq/what-instruments-can-i-trade/