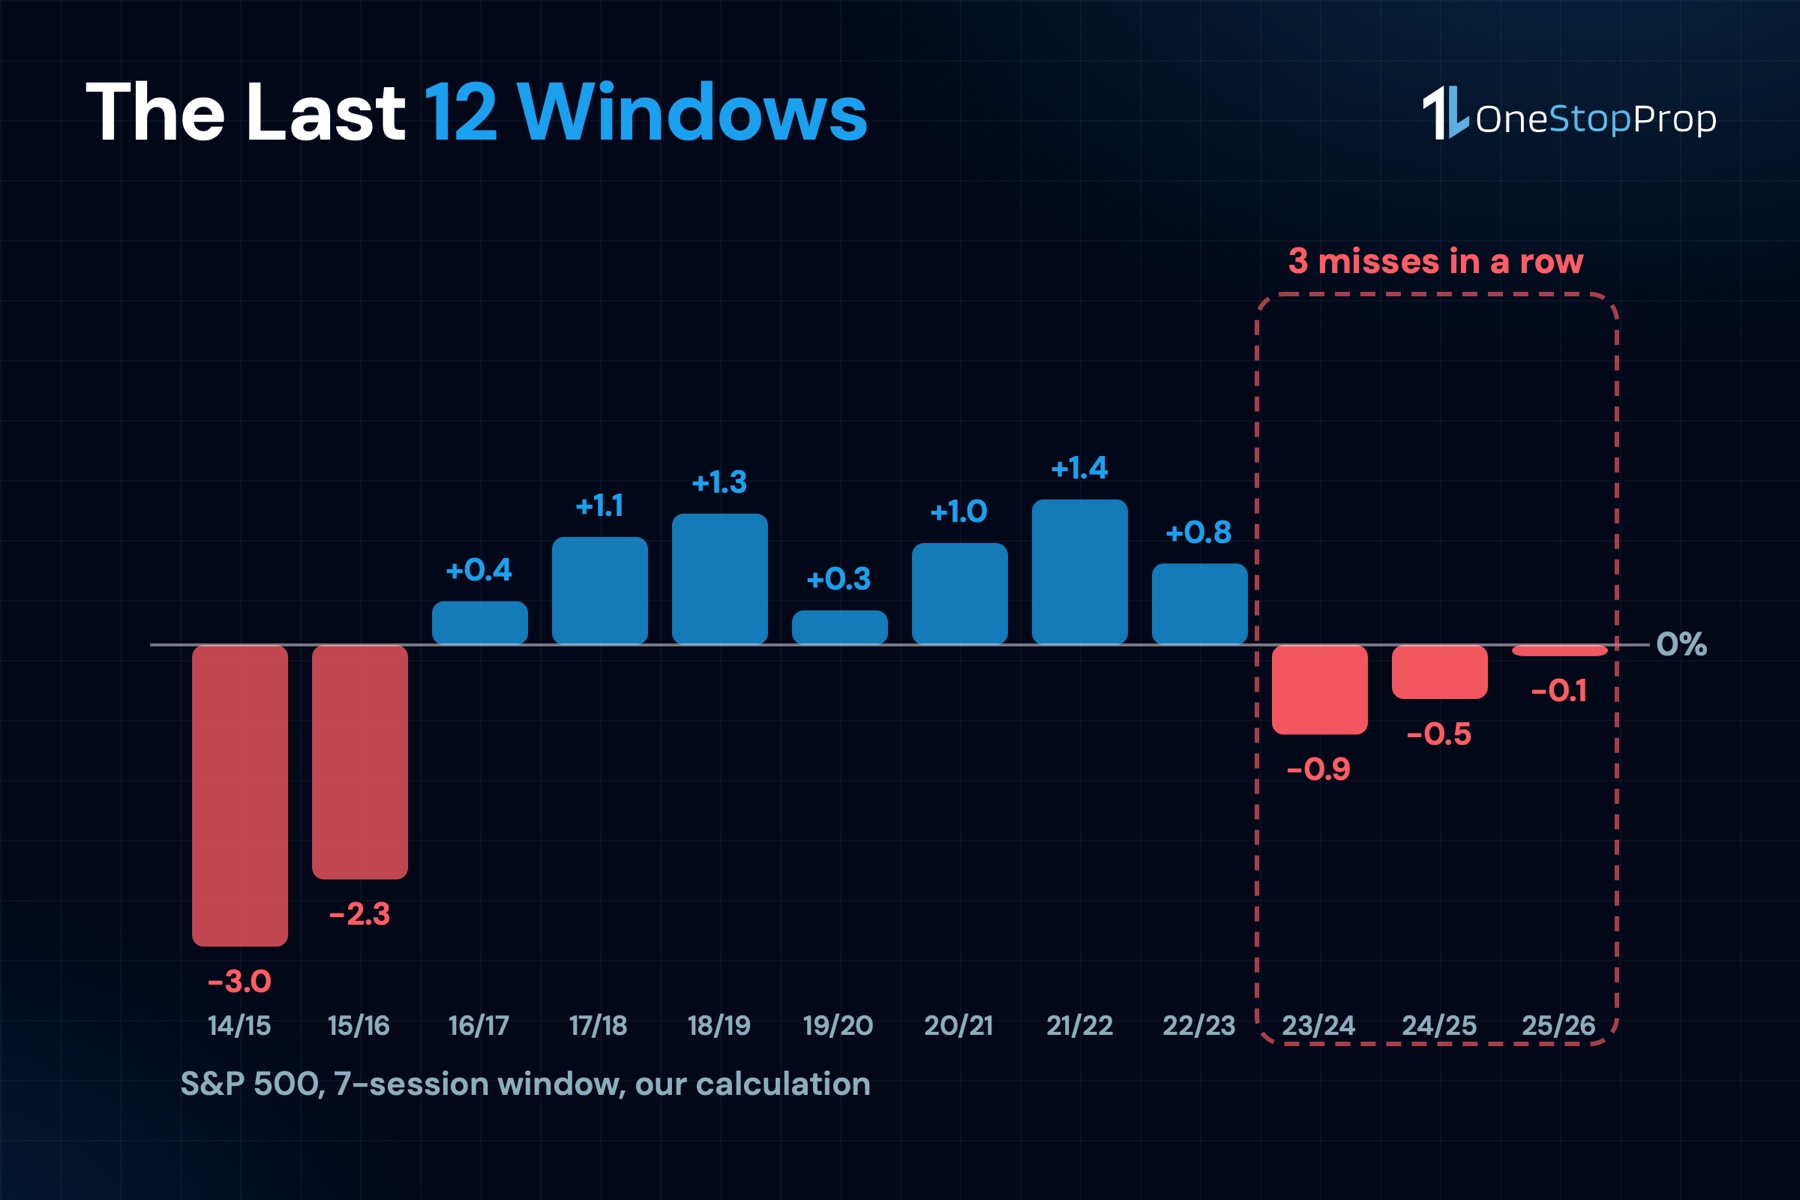
The santa claus rally has failed 3 years in a row. The seven-session window that is supposed to close the year green came in at -0.88% for 2023/24, -0.53% for 2024/25 and -0.11% for 2025/26, measured on S&P 500 closes. Every December, santa claus rally stock market headlines still quote the same cheerful statistic, and every January a fresh batch of traders finds out that a seasonal pattern is not a trade plan.
That matters more if you are trading someone else’s capital. A buy-and-hold investor who sits through a 2% dip gets it back. A funded trader who sits through the same dip in a leveraged position can lose the account before the pattern has a chance to pay.
This guide gives you the exact dates of the 2026/27 window from the NYSE calendar, 46 years of return data we calculated ourselves, and the part almost nobody publishes: what the path to that average actually looks like when you have a daily loss limit.
Key Takeaways
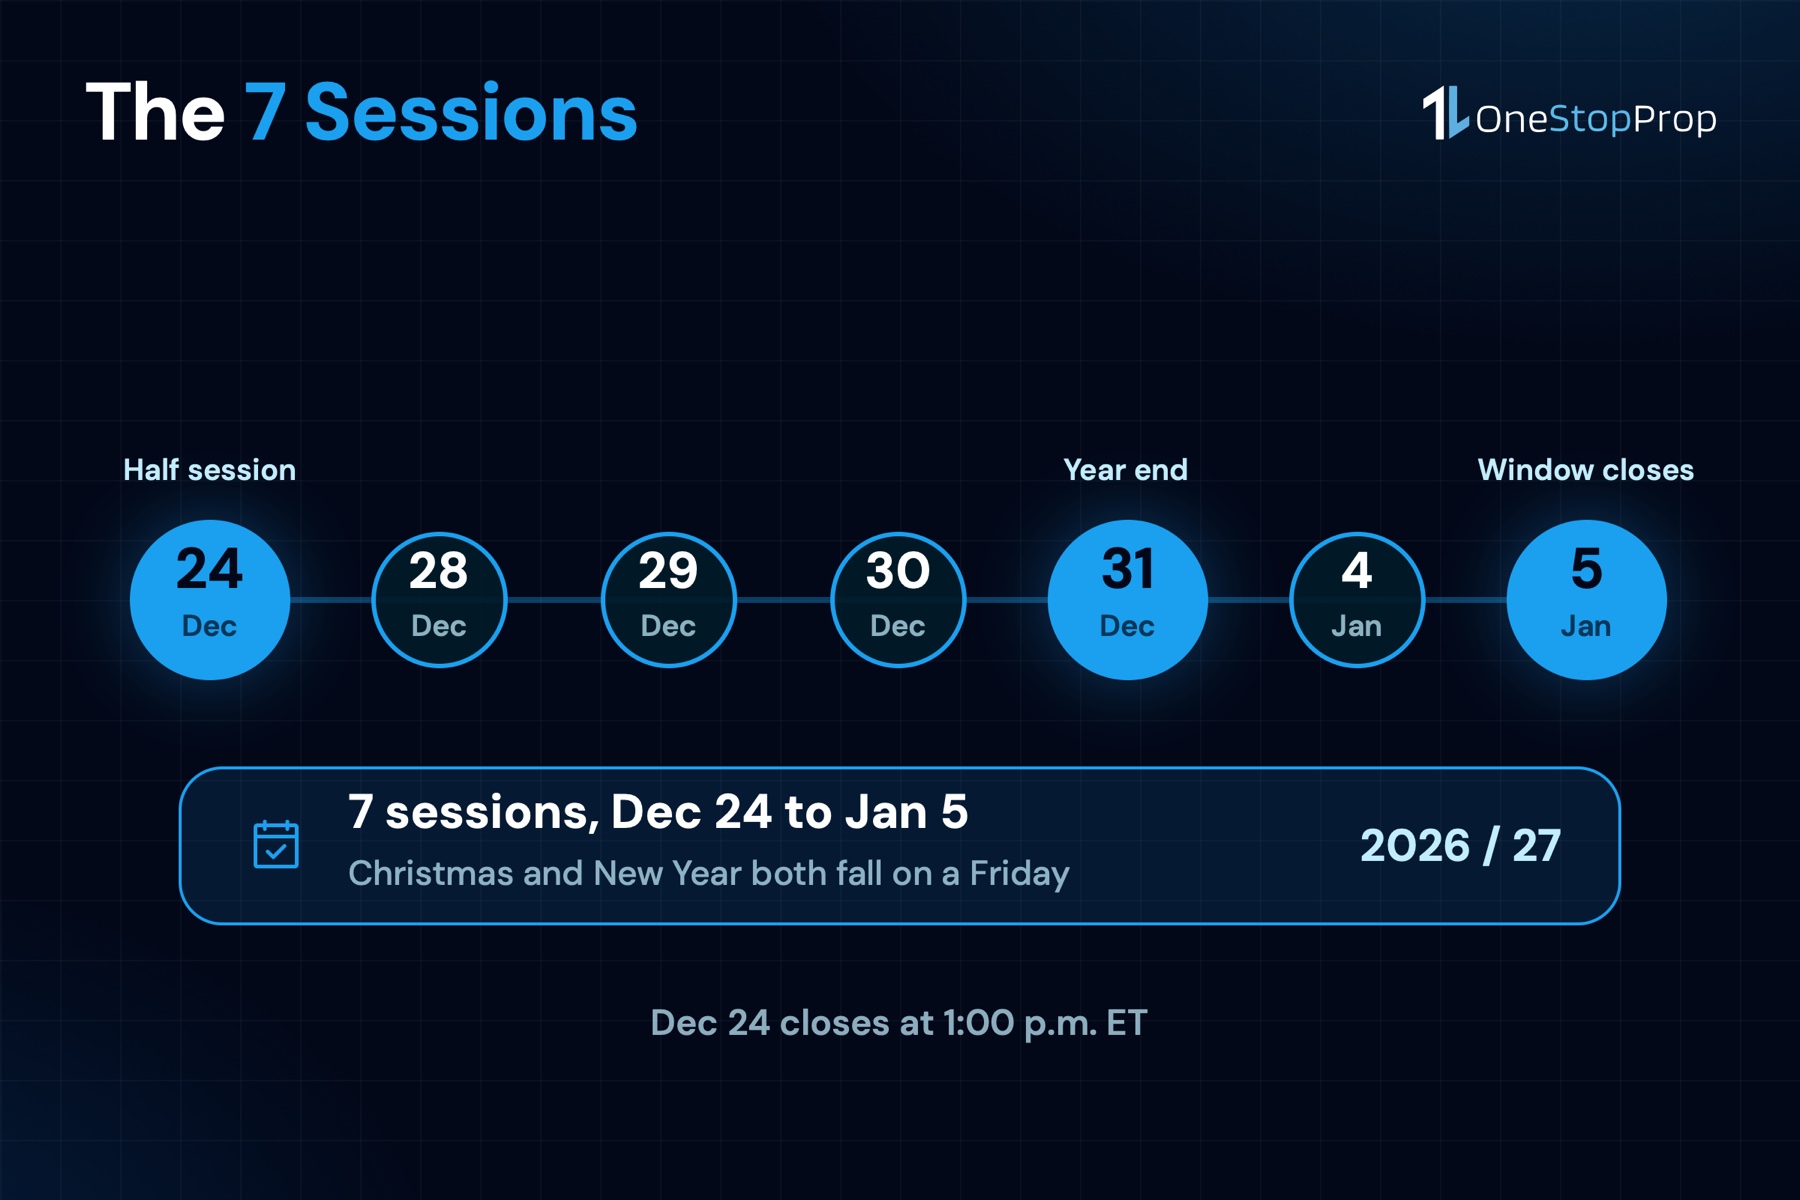
- The 2026/27 window runs December 24, 28, 29, 30 and 31, then January 4 and 5. Christmas falls on a Friday in 2026 and New Year’s Day on a Friday in 2027, so the calendar is tighter than usual and December 24 is a half session that closes at 1:00 p.m. ET.
- Across 46 periods since 1980, the S&P 500 finished the window higher 32 times, or 69.6%, with an average gain of 0.85%. That is a real edge, and it is smaller than most articles suggest.
- The average window also contained a 1.61% peak-to-trough drawdown. The net result is positive; the path is not. That distinction is the whole game on a funded account.
- It has missed 3 times in a row, which is the longest losing streak in the data since the mid-1980s. Treat the pattern as context, not as a signal.
- The move is smaller than your daily loss limit. On a $100K OneStopProp account the daily cap is 4%. A 0.85% index move over 7 sessions is not something you can size up into without inverting the risk-reward of your account.
When Is the Santa Claus Rally in 2026?
The exact sessions
Yale Hirsch defined the period in 1972 as the last 5 trading days of December plus the first 2 of January. That definition is fixed, but the dates move every year with the calendar, and 2026 lands awkwardly.
The NYSE holiday calendar confirms 2 things. Christmas Day 2026 falls on Friday, December 25, so the market is closed. New Year’s Day 2027 falls on Friday, January 1, also closed. That pushes the first January session to Monday, January 4.
| Session | Date | Note |
|---|---|---|
| 1 | Thursday, December 24, 2026 | Half session, closes 1:00 p.m. ET |
| 2 | Monday, December 28, 2026 | |
| 3 | Tuesday, December 29, 2026 | |
| 4 | Wednesday, December 30, 2026 | |
| 5 | Thursday, December 31, 2026 | Last session of the year |
| 6 | Monday, January 4, 2027 | |
| 7 | Tuesday, January 5, 2027 | Window closes at the bell |
Why the half session matters
December 24 closes 3 hours early. Volume in that session is routinely a fraction of a normal day, and the closing auction is thin. If you are used to sizing positions off average volume, the same position size behaves differently when the book is empty.
For a funded trader, that is not a footnote. Thin books widen spreads and make stops fill worse than they model. The daily loss limit does not get more generous because liquidity left for the holidays.
What the Santa Claus Rally Stock Market Data Actually Shows
The number most articles quote
Investopedia puts the long-run figure at an average gain of 1.3% since 1950, positive about 78% of the time. Going back to 1928 the average rises to 1.6%. Those numbers are correct for their starting point, and they are the ones you will see quoted every December.
The number we calculated
We ran the same 7-session window on S&P 500 closing prices for the 46 periods from 1980/81 through 2025/26. The result is a little more sober:
| Measure | Result |
|---|---|
| Periods measured | 46 (1980/81 to 2025/26) |
| Finished higher | 32, or 69.6% |
| Average return | +0.85% |
| Best period | 2008/09, +7.45% |
| Worst period | 1999/00, -4.04% |
| Last 10 periods | 7 positive, +0.48% average |
The gap between 78% and 69.6% is the starting point of the series, not a contradiction. The 1950s and 1960s were unusually kind to this pattern. If you are trading in 2026, the last 46 years are the more honest sample, and the last 10 are more honest still.
Three misses in a row
The streak is what makes this year interesting. The window came in negative in 2023/24, 2024/25 and 2025/26. 3 misses in a row is the longest run of failures in our sample since the mid-1980s.
Hirsch’s own rhyme warns about this: “If Santa Claus should fail to call, bears may come to Broad and Wall.” The historical examples are real. A 4% drop in the 1999/00 window preceded a long bear market, and the 2007/08 window came in negative just before the financial crisis. But 2023/24 and 2024/25 were both followed by perfectly normal years. A 3-year streak tells you the pattern is weak right now. It does not tell you what January does.
The Part That Matters on a Funded Account
The average hides the path
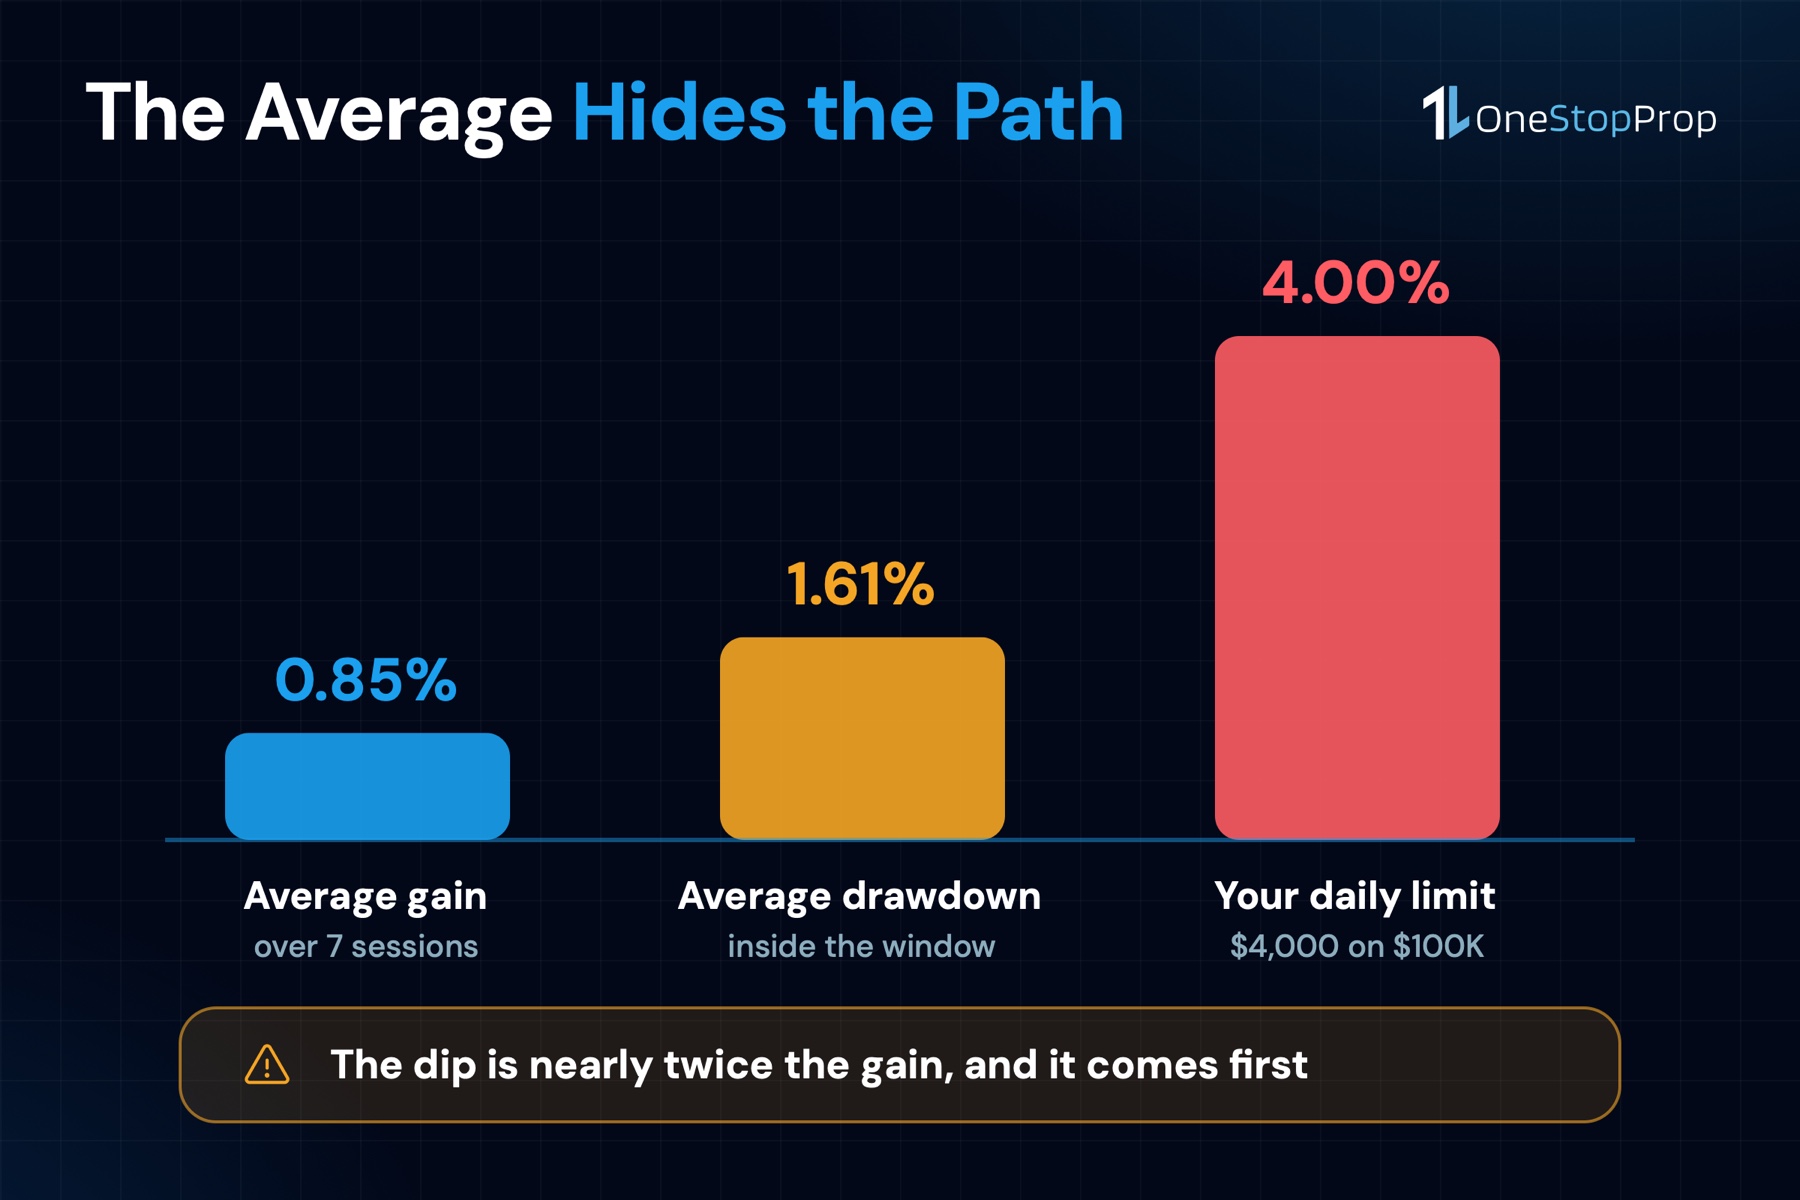
Here is the statistic that changes how you trade this window, and it is the one you will not find in the standard explainer. Across those same 46 periods, the average peak-to-trough drawdown inside the window was 1.61%.
Read that against the average return of 0.85%. The typical Santa Claus rally is a 7-session stretch that ends up slightly positive after dipping almost twice that much along the way. 14 of the 46 windows drew down 2% or more. 22 of them, nearly half, contained at least 1 single session of -1% or worse.
What this means in practice: if you enter the window long and size the position for a 0.85% move, a routine 1.6% dip against you is not a surprise. It is the base case.
Running the numbers on a $100K account
Put real limits on it. A $100K Standard 2 Step account at OneStopProp carries a 4% maximum daily loss, which is $4,000, and an 8% maximum total loss. The daily limit resets at 12:00 AM ET on the higher of your balance or equity.
An index moving 1% in a session is not what closes accounts. A single stock moving 3% while you hold a leveraged position through a thin holiday session is. The Magnificent 7 names routinely move more than the index, and the index is what the 0.85% statistic describes.
| S&P 500 window | Your daily limit | |
|---|---|---|
| Average 7-session return | +0.85% | not applicable |
| Average drawdown inside the window | -1.61% | 4% of starting balance |
| Windows with a -1% day or worse | 22 of 46 | 1 breach ends the account |
The asymmetry is the point. The upside the pattern offers is smaller than the cushion you are risking to capture it.
Position sizing for a thin tape
If you decide to trade the window, size for the drawdown rather than the average. Three adjustments do most of the work:
- Cut normal size. If your usual risk is 1% of the account per trade, the holiday window is where you run 0.5%. The edge did not get bigger; the slippage did.
- Set a personal daily stop well inside the firm’s. Stopping at roughly 80% of the stated daily cap leaves room for a bad fill on a thin book.
- Decide overnight exposure in advance. OneStopProp permits overnight and weekend holds, which is genuinely useful here because the window spans 2 weekends. Useful is not the same as automatic. Decide before December 24 what you are willing to carry through a 3-day gap.
How to Trade the Window Without Betting on It
Trade what the calendar does, not what the statistic says
The reliable feature of late December is not direction. It is the schedule. Volume thins out, index rebalancing is done, and the tape is driven by fewer participants. That produces cleaner ranges in liquid large caps and messier behavior in everything else.
A practical read: stick to the names with the deepest books. AAPL, MSFT and NVDA still trade properly on December 29. A thin mid-cap on the same day is a different instrument than it was in November.
The setup most funded traders should take
For traders inside an evaluation, the window is usually the wrong place to push for a profit target. There is no time limit on a OneStopProp challenge, which means waiting costs you nothing. Passing an evaluation in a low-liquidity week to save 5 days is a bad trade against a rule set you have to live with for months.
For traders already funded, the calculation is different. The consistency rule on a payout cycle, 25% on a Standard account and 20% on a Pro account, means no single day can make up that share of your profit for the period. A big holiday win can actually delay a payout by concentrating your profit into one session. That is worth knowing before you swing for it.
If you are flat, that is a position
The most defensible answer for a lot of accounts is to sit out December 24 and be back for January 4. You give up an average of 0.85% of index movement that you were never going to capture in full, and you skip the sessions where fills are worst. A month with no rule breach is worth more than a week with a small edge.
Where the Window Sits in the Rest of Q4
The rally is the last 7 sessions of a quarter that has its own rhythm, and the sessions before it behave nothing like the ones inside it.
October: earnings do the moving
Third-quarter earnings land through October, and for a stock trader that is the opposite problem from the holiday window. Liquidity is fine. The risk is the gap. A single name can open 8% away from where it closed, and no stop protects you through a halt or an after-hours print.
This is where the rule set matters more than the calendar. On a funded account, all trades have to be closed 5 minutes before a scheduled release and reopened 5 minutes after, and individual stock earnings are on that list. News trading is permitted on Pro accounts. Knowing which account you hold decides whether earnings season is an opportunity or a disqualification.
November: the deepest liquidity of the quarter
November is the quarter’s working month. Earnings are mostly done, volume is full, and the tape behaves. If you are trying to pass an evaluation in Q4, this is the month to do it, not late December.
There is one structural date to note: the day after Thanksgiving, Friday, November 27, 2026, is a half session that closes at 1:00 p.m. ET, same as December 24.
December: rebalancing, then nothing
The first half of December carries index rebalancing and options expiry, which concentrates volume on specific days. After that, participation drains week by week into the window this article is about.
The practical sequence for a funded trader is simple. Use October carefully around earnings, do the real work in November, and treat the last 2 weeks of December as a period to protect what you built rather than add to it.
Frequently Asked Questions
What is the santa claus rally?
It is the tendency of the S&P 500 to rise over a specific 7-session window: the last 5 trading days of December plus the first 2 of January. Yale Hirsch named it in 1972 in the Stock Trader’s Almanac. It is a seasonal pattern measured after the fact, not a scheduled event, and it has finished negative in 14 of the 46 periods since 1980.
When is the santa claus rally in 2026?
It starts on Thursday, December 24, 2026, which is a half session ending at 1:00 p.m. ET, and runs through Tuesday, January 5, 2027. The full list of sessions is December 24, 28, 29, 30 and 31, then January 4 and 5. Christmas Day and New Year’s Day both fall on a Friday, so the market is closed both days.
How reliable is the santa claus rally?
Using S&P 500 closes from 1980/81 through 2025/26, the window finished higher in 32 of 46 periods, or 69.6%, with an average gain of 0.85%. Longer series starting in 1950 put the hit rate closer to 78%. Either way, it fails roughly 1 year in 4, and it has failed each of the last 3 years.
Can I trade the santa claus rally with a funded account?
Yes, and the rules are the same as any other week. The thing to plan around is not the pattern but the liquidity. The average window contains a 1.61% peak-to-trough drawdown, and nearly half contain a session of -1% or worse, so a position sized for the average move can still run into your daily loss limit on the way there.
Will there be a santa claus rally this year?
Nobody knows, and anyone who tells you otherwise is guessing. What the data supports is a base rate: the window closed higher in 32 of the 46 periods since 1980, so roughly 7 years out of 10. It has also missed 3 years running, the weakest stretch in decades. Plan for both outcomes and size the position so neither one decides your month.
What does it mean when there is no santa claus rally?
It means the 7-session window closed flat or lower, which happened in 14 of the 46 periods we measured. Yale Hirsch’s rhyme warns that “if Santa Claus should fail to call, bears may come to Broad and Wall,” and the 1999/00 and 2007/08 misses did precede major declines. The 2023/24 and 2024/25 misses did not. A missed window is a data point, not a forecast.
Do stock prop firms let you hold through the holidays?
It depends on the firm, and it is worth checking before December. OneStopProp allows overnight and weekend holds, which matters in a window that spans 2 weekends. Firms that force a flat close each day turn the same 7 sessions into a completely different exercise.
The Bottom Line
The santa claus rally is real in the narrow sense that the 7 sessions from December 24 to January 5 have closed higher about 70% of the time since 1980. It is also smaller than its reputation, it has missed 3 years running, and the average window contains a drawdown roughly twice the size of the average gain.
For a funded trader, that combination points one direction. Trade the window for the setups your strategy already finds, at reduced size, in the deepest names, with a personal stop well inside the firm’s limit. Do not build a position around a statistic whose entire edge is smaller than a single bad fill.
The dates are fixed and you can plan around them now: December 24, 28, 29, 30, 31, then January 4 and 5.
If you want to trade that window on capital that is not yours, OneStopProp funds stock traders from $10K to $300K with no time limit on the evaluation, overnight and weekend holds permitted, and charts on TradingView with execution on Match-Trader. The free monthly competition is a no-cost way to see how your strategy handles a full calendar month before you pay for anything.
Sources
- Holidays & Trading Hours, NYSE. Official 2026 and 2027 market holidays and the December 24, 2026 early close. https://www.nyse.com/markets/hours-calendars
- Santa Claus Rally: What It Is and Means for Investors, Investopedia. Hirsch’s definition, the 1950 and 1928 series, and the January Trifecta. https://www.investopedia.com/terms/s/santaclauseffect.asp
- S&P 500 daily closing prices (^GSPC), 1980 to 2026, via Yahoo Finance. Our own calculation of the 46-period sample, including the drawdown figures, runs on this series. https://finance.yahoo.com/quote/%5EGSPC/history/
- Trading Rules, OneStopProp Help Center. Maximum daily loss, the 12:00 AM ET reset, overnight and weekend holds. https://help.onestopprop.com/category/trading-rules/
- Payout Information and Guidelines, OneStopProp Help Center. Consistency rule by account type and payout cycles. https://help.onestopprop.com/faq/payout-rules/
- OneStopProp Checkout, OneStopProp. Account paths, types, sizes and rule sets. https://checkout.onestopprop.com/checkout/