Whether you are applying to your first prop firm or managing a funded account, your TradingView stock analysis prop firm routine decides whether you stay within the rules or blow out. TradingView is primarily a charting platform and one of the very best around. It has become the go-to analysis workspace for a growing wave of retail prop traders, and for good reason. Between 2021 and 2026, the retail prop trading market expanded from approximately $450 million to $850 million, despite increased regulatory headwinds.
More capital is flowing into retail prop programs than ever, which means competition is sharper and your analytical edge matters more. Use TradingView correctly in your challenge, and you will be making data-backed decisions on every trade; use it poorly, and you will be guessing with someone else’s money.
This guide walks you through every stage of TradingView stock analysis prop firm work: setting up your workspace, selecting the right indicators, running multi-timeframe analysis, backtesting your strategy, and keeping your drawdown under control, all through TradingView’s tools.
Key Takeaways
- TradingView’s indicator library is enormous, but restraint wins: Traders often use 2-3 indicators to avoid overcomplication and conflicting signals. In a prop firm evaluation, a clean setup reduces hesitation and impulsive overrides.
- Daily drawdown discipline is the primary reason challenges fail: Roughly 71% of first-phase failures come from daily drawdown breaches, not poor strategy. Use TradingView’s alert tools to warn yourself before you breach the line.
- Multi-timeframe analysis delivers higher-probability entries: Multi-timeframe analysis is the single most impactful improvement a trader can make to their indicator-based strategy, using higher timeframes to establish context and lower timeframes to time entries.
- Backtesting in TradingView is only useful if it mirrors your prop firm’s rules: The evaluation is a different objective function, and you have to encode it in your Pine Script strategy, terminal profit is secondary to path-dependent constraints like drawdown.
- Stock access matters for prop firm traders: Firms that let you analyze and trade high-cap stocks like Apple (AAPL), NVIDIA (NVDA), and Microsoft (MSFT) give you more setups to work with and more opportunities to meet profit targets cleanly.
Quick-Start Prioritization Framework
| Step | Best For | Effort Level | Time to Impact |
|---|---|---|---|
| Build your TradingView workspace | All traders | Low | Immediate |
| Apply a 3-indicator stack | Day traders and swing traders | Low | Within 1 session |
| Set up multi-timeframe layouts | Intermediate and above | Medium | Within 1 week |
| Backtest with prop firm drawdown rules | Strategy-focused traders | High | 1-3 weeks |
| Configure drawdown alerts | All funded-account traders | Low | Same day |
| Screen for high-cap stocks to trade | Stock traders | Low | Immediate |
Start here if you are:
- A complete beginner: Build the workspace and apply a 3-indicator stack first, fastest route to structured decision-making.
- An intermediate trader entering your first challenge: Prioritize multi-timeframe layouts and drawdown alerts before anything else.
- An experienced trader prepping a funded account: Run your full strategy through a prop-firm-calibrated backtest before risking a single dollar.
Step 1, Build a Prop-Firm-Ready TradingView Workspace
Before you choose a single indicator, get your environment right. TradingView stock analysis prop firm work starts with the layout, not the tools. A cluttered or disorganized workspace creates hesitation at entry, and hesitation in a challenge creates overtrading, which creates drawdown.
Choosing Your TradingView Plan
TradingView’s Basic plan is free and gives you 1 chart per tab and 1 saved layout, which is enough to learn the platform and nothing more. Essential runs $14.95 a month billed monthly ($12.95 billed annually) and moves you to 2 charts per tab, 5 indicators per chart and 20 price alerts. Plus runs $34.95 a month billed monthly ($29.95 annually) and gives you 4 charts per tab, 10 indicators and 100 alerts.
That chart count is the number that decides your plan, because the 3-panel workspace below needs 3 charts open at once: Essential fits 2, so the 3-panel layout starts at Plus. One more thing traders miss: real-time US stock data is an exchange subscription sold on top of the plan, not something the plan includes by itself.
Setting Up Charts and Layouts
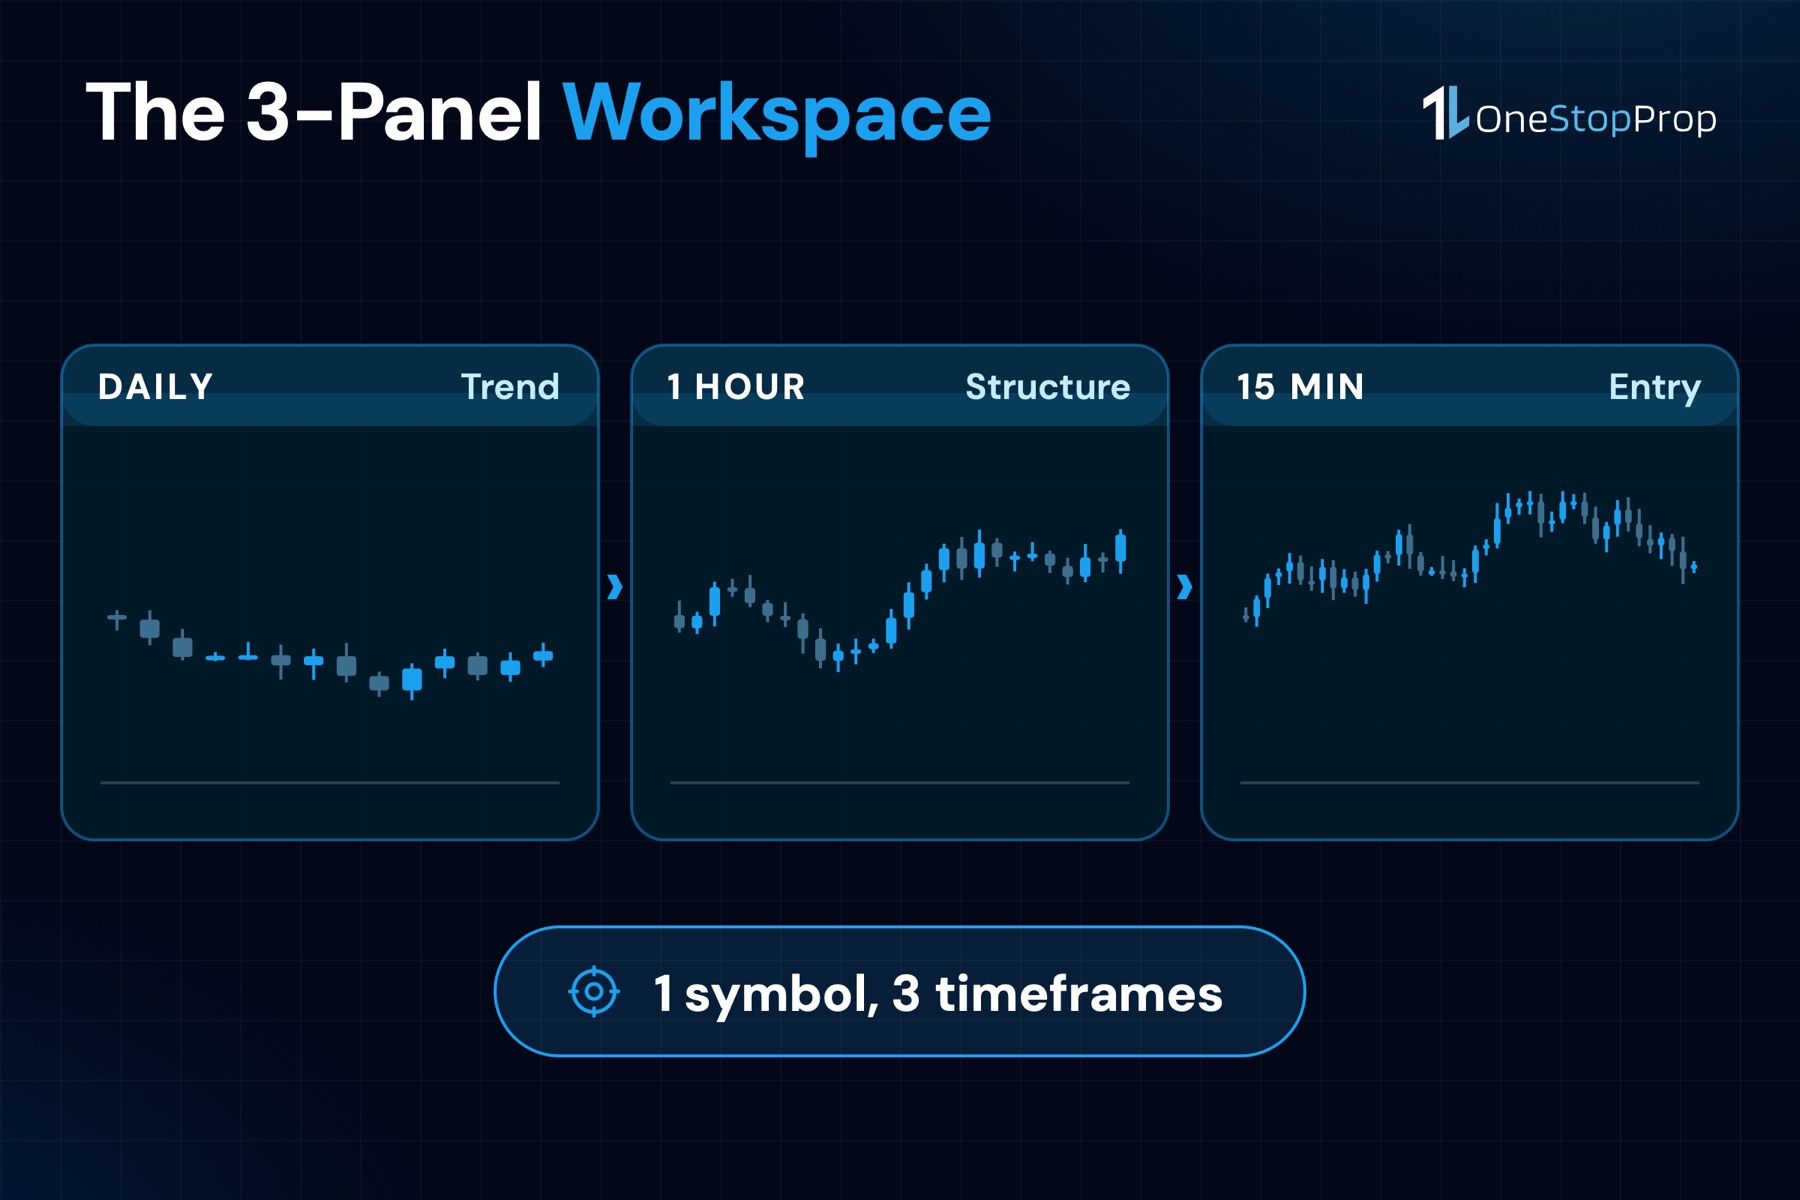
TradingView’s multi-chart layout allows traders to monitor different markets, timeframes, and instruments within a single workspace. A practical 3-panel setup assigns 1 panel to the daily chart for trend context, 1 panel to the 1-hour chart for structure, and 1 panel to the 15-minute chart for entries.
Worth saying out loud: your analysis lives in your own TradingView account and your orders live in the platform your prop firm gives you, so build the workspace where you study the chart, not where you click buy. TradingView’s cloud-based nature delivers value across all platforms, your charts, indicators, and custom scripts sync across desktop, web, and mobile, allowing you to analyze a setup on your phone during lunch and execute it later from your desktop without recreating your workspace.
Pro Tip: Save your workspace template before your challenge begins. Rebuilding your layout mid-challenge wastes time and introduces errors when markets are moving.
Organizing Your Watchlist
Whether used as a standalone feature or alongside Supercharts, TradingView’s screener allows you to filter thousands of stocks based on your specific investment criteria, combining multiple filters to create comprehensive tables displaying stock metrics and fundamental data.
For a prop firm challenge, build a focused watchlist of 10-15 instruments rather than scanning hundreds. Stock traders at firms that offer access to the Magnificent 7, Apple (AAPL), NVIDIA (NVDA), Microsoft (MSFT), Amazon (AMZN), Alphabet/Google (GOOGL), Meta (META), and Tesla (TSLA), already have a natural starting list of high-liquidity stocks with clear technical patterns and wide daily ranges. Each of those names behaves differently, which is why it pays to read how to trade the Magnificent 7 stocks through a prop firm before building the watchlist.
Step 2, Select Your Core Indicator Stack
Indicators are outputs from mathematical calculations based on specific market data, such as past price movements, trading volume, and other market data, used mainly by traders to conduct technical analysis. The goal is to select 2-3 that complement each other rather than repeat the same information.
The VWAP + RSI + MACD Framework
In my experience, this 3-indicator combination is the most practical stack for both day traders and swing traders working inside prop firm rules. Each tool covers a different dimension of price behavior.
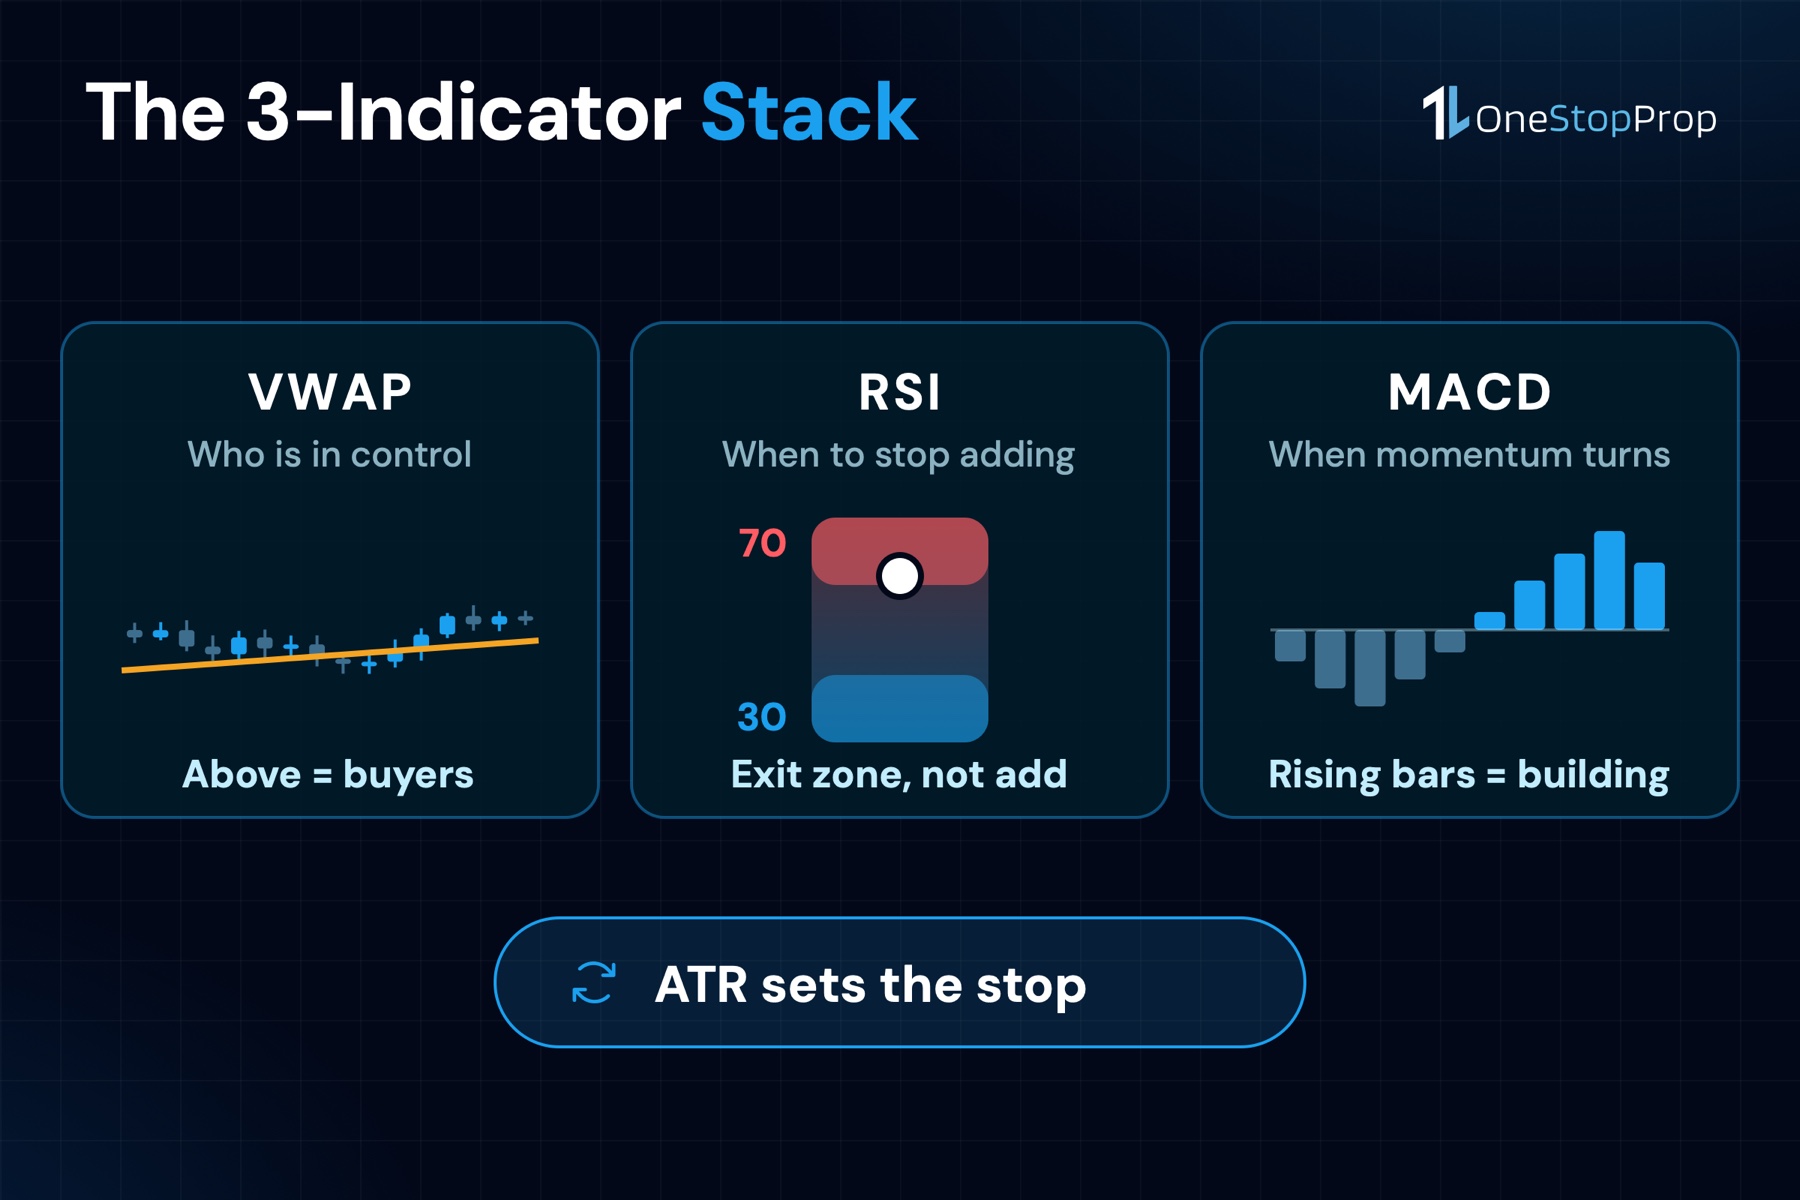
VWAP, Volume-Weighted Average Price, tracks intraday fair value price based on volume. When price is above VWAP, institutional buying pressure is dominant; below VWAP, selling pressure is dominant. Use VWAP as your directional filter before entering any intraday trade on stocks like TSLA or NVDA, both of which trend aggressively relative to VWAP during earnings windows.
The MACD is one of the most popular technical indicators because it shows the direction of a trend and the strength of buy or sell signals. Use the MACD histogram to time your entry: rising histogram bars confirm building momentum; falling bars signal that a move is losing steam. Never fight the histogram direction on a prop firm account where every losing trade eats into your daily drawdown buffer.
Use RSI to identify potential reversal points: RSI above 70 indicates overbought conditions, and below 30 indicates oversold conditions. In a prop firm context, an RSI approaching 70 on a stock you are long in signals a potential exit zone rather than an add zone. This is where discipline separates funded traders from those who blow challenges.
Pro Tip: The MACD should be used in conjunction with other indicators, never as a standalone entry signal. A MACD crossover that occurs below VWAP on a down-trending day is a trap, not a setup.
Adding Average True Range for Position Sizing
The Average True Range (ATR) is one of the most established market volatility indicators on TradingView. ATR tells you how much a stock typically moves in a single session.
Use it to set your stop-loss distance: if AAPL has an ATR of $2.50, a stop closer than $1.25 away will likely get hit by normal daily noise before your target is reached. If your prop firm limits daily drawdown to 4%, ATR-calibrated stops keep you trading longer within that limit. The mechanics behind that number are worth knowing before you size a single trade: how prop firm drawdown rules work for stock traders decides how much room you actually have.
Step 3, Master Multi-Timeframe Analysis
Single-timeframe trading is like reading one paragraph of a book and trying to understand the whole story. You might catch the current sentence, but you are missing the chapter structure, the narrative arc, and the conclusion. Multi-timeframe analysis fixes this by using higher timeframes to establish context and lower timeframes to time entries. It is the part of TradingView stock analysis prop firm traders skip most often.
The 3-Timeframe Model
Multi-timeframe analysis works across 3 layers: the higher timeframe (Daily/Weekly) shows trend direction and key support/resistance zones, this is your compass. The mid timeframe (4H) reveals the market structure, swing highs, swing lows, consolidation ranges, this is your map. The lower timeframe (1H/15M) provides precise entry and exit signals, this is your trigger.
For stock traders, I have found this model particularly effective on the Magnificent 7 names because they trend cleanly. A daily chart shows whether META is in an uptrend above a rising 20-day moving average. The 4-hour chart confirms whether a pullback is shallow and healthy or breaking structure. The 15-minute chart then gives a precise candle-level entry near support.
Setting Up Multi-Chart Layouts in TradingView
2 practical ways to do multi-timeframe analysis on TradingView: a multi-chart layout where you split your screen into 2-3 panels, each showing the same symbol on a different timeframe (Daily, 1-Hour, 15-Minute), and using Pine Script’s request.security() function to pull higher-timeframe data directly onto your current chart. For most traders, the split-panel approach is faster to learn and easier to read under live market conditions.
Avoiding Timeframe Conflicts
Timeframes that sit too close together, such as 1H and 2H, show nearly identical information. The goal is separation. Use timeframes with at least a 4-to-1 ratio: daily, 4-hour, and 15-minute work well. Daily and 1-hour are acceptable. Daily and 30-minute are the minimum usable gap for stock intraday setups.
Step 4, Backtest Your Strategy Against Prop Firm Rules
This step is where most traders cut corners, and it costs them. Backtesting in TradingView is powerful, but a standard backtest does not reflect how prop firm drawdown rules actually work.
Using Pine Script for Prop-Firm-Calibrated Backtests
Pine Script strategies are specialized scripts that simulate trades across historical and realtime bars, allowing users to backtest and forward test their trading systems, with many of the same capabilities as indicator scripts, along with the ability to place, modify, and cancel hypothetical orders and analyze performance results.
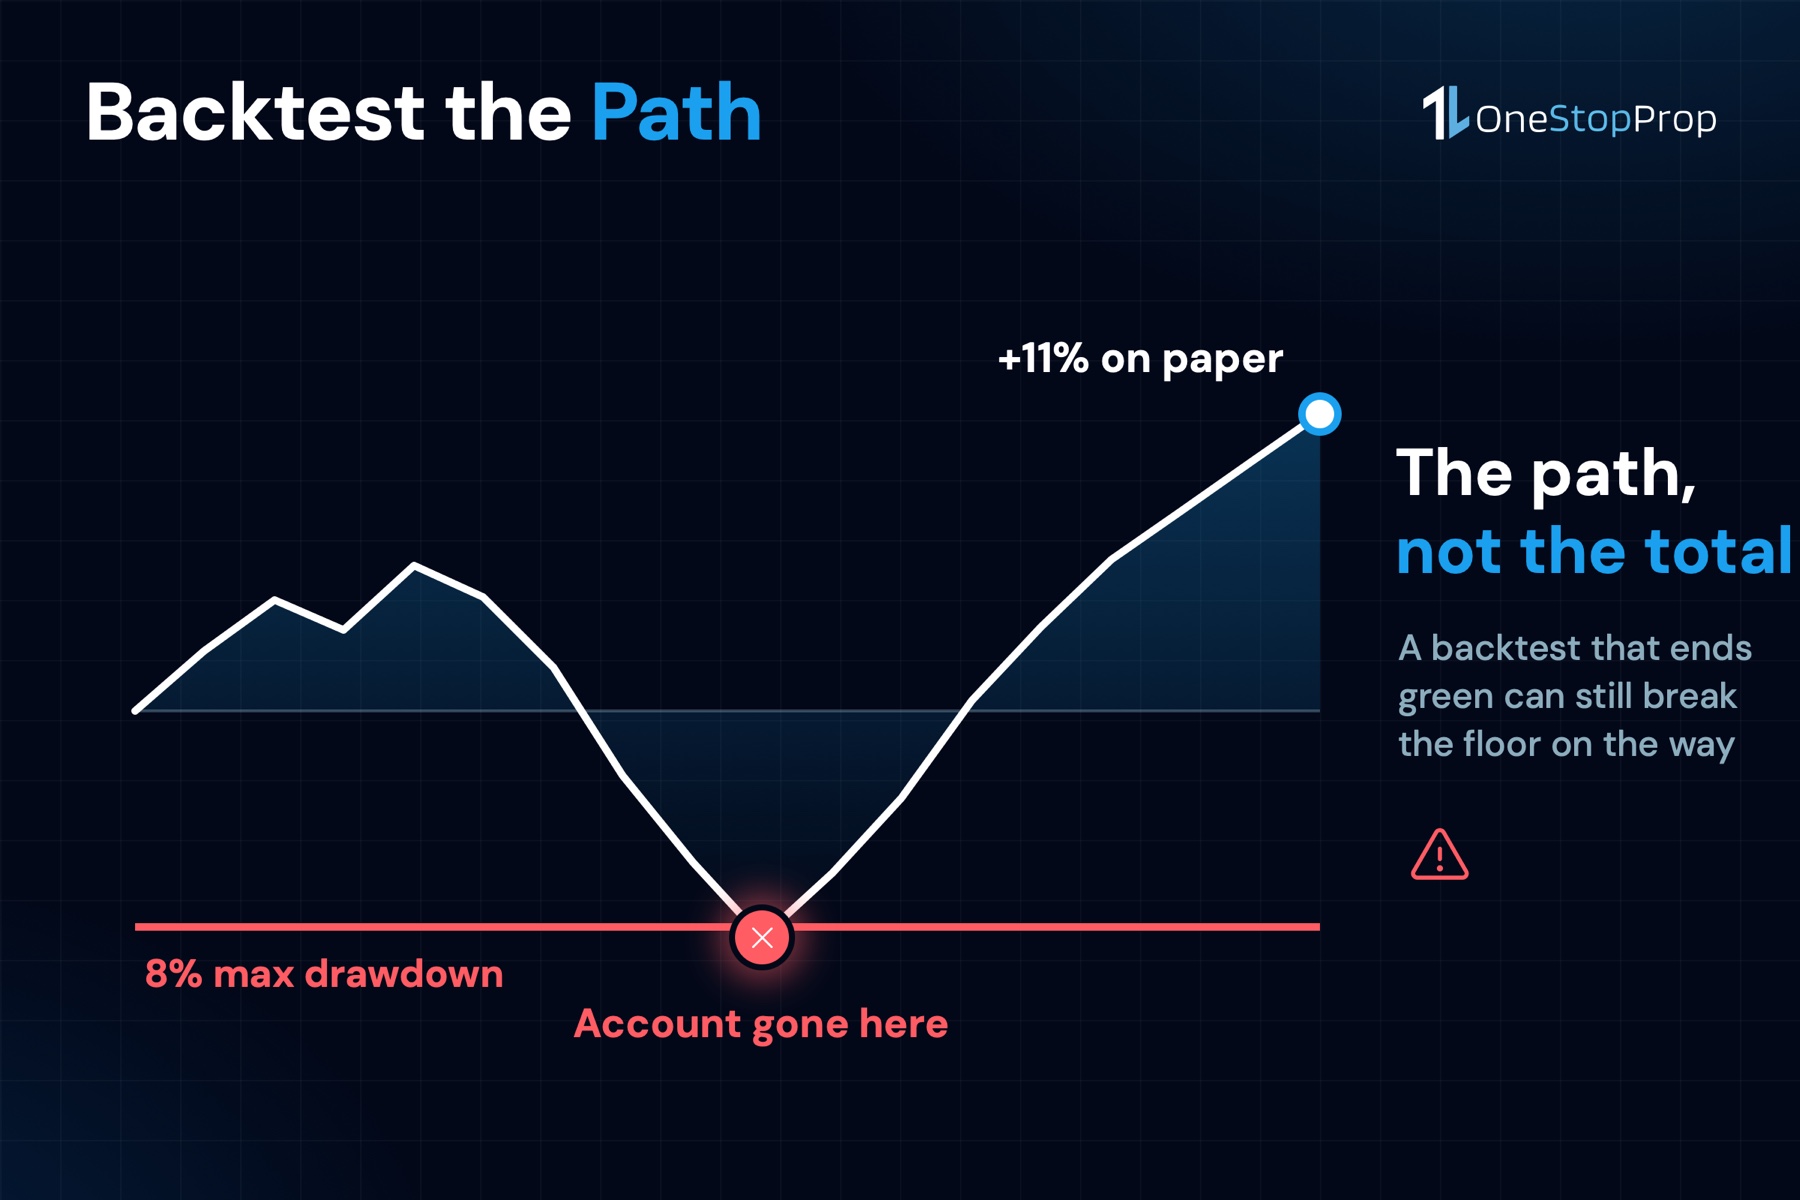
Pine Script’s strategy() framework evaluates terminal equity, but prop firms evaluate a path-dependent constraint called trailing drawdown. This distinction is critical. A strategy can be profitable in the Strategy Tester and still consistently fail prop evaluations. Therefore, before purchasing any challenge, build a drawdown simulation layer into your Pine Script backtest that tracks your equity path against the firm’s specific drawdown floor.
Reading Backtest Results Critically
The core metrics needed to judge a strategy’s performance are net profit, win rate, trade count, profit factor, and maximum drawdown. For a prop firm challenge, prioritize maximum drawdown and winning consistency over raw profitability. This is the same logic behind prop firm risk management for stocks: the floor decides the position size, not the other way around. A strategy with a 55% win rate and a maximum drawdown of 3% is far safer in a challenge environment than a 70% win-rate strategy with a 7% maximum drawdown, especially when your total drawdown limit sits at 8%.
Pro Tip: TradingView highly recommends exploring Paper Trading to test out different indicators and find your optimal setup in a completely risk-free environment before committing to a live challenge.
Step 5, Use TradingView Alerts to Protect Your Drawdown
Analysis without risk management is entertainment. TradingView stock analysis prop firm discipline lives in the alerts, not in the chart. In a prop firm challenge, alerts are the operational layer that keeps your analysis honest.
Building a Daily Drawdown Alert System
The most useful script you can add to a challenge account is a risk dashboard that keeps the 3 numbers that decide whether the account survives on one screen: the daily loss limit, the max drawdown floor, and the size of your next trade.
Set price-level alerts in TradingView that fire when a stock moves against you by a defined dollar amount. For a firm with a 4% daily drawdown limit on a $100,000 account, that is a $4,000 intraday maximum loss. Map that to your ATR-calibrated stop sizes, and you will know exactly how many simultaneous positions you can safely hold before you hit the daily limit. If you hold 2 open stock positions and each risks $1,800, you have $400 of daily buffer remaining, not enough to open a 3rd trade.
Setting Alerts for Key Technical Levels
Screeners help day traders identify breakout stocks by filtering for key technical signals, such as price moves above resistance levels, new 52-week highs, or high relative volume. Set TradingView alerts at these levels ahead of the trading session so you are notified the moment price approaches a pre-planned setup zone. This removes the need to stare at charts all day and prevents the impulsive, unplanned entries that cause drawdown spikes.
Putting It All Together with OneStopProp
Once your TradingView stock analysis prop firm process is structured and tested, the next step is finding a firm whose rules actually support the way you trade. OneStopProp is built as a prop firm for stock traders first, with forex and crypto as additional options in the same funded account.
The 2-phase challenge requires an 8% profit target in Phase 1 and a 5% profit target in Phase 2, with a 4% maximum daily drawdown and 8% maximum total drawdown, thresholds that align well with ATR-based position sizing on high-cap stocks. A no-time-limit challenge means there is no deadline for hitting your profit target; you can take 20 days or 90 days, as long as you stay within the drawdown rules, the account stays live. That structure rewards the patience that proper multi-timeframe analysis demands.
Execution happens in the firm’s platform, Match-Trader, and OneStopProp runs TradingView-powered charts inside it, so the levels you mark in your own TradingView workspace are the ones you look at when you place the order. The layouts, alerts, Pine Script backtests and screener stay in your TradingView account: that is the part you are paying for.
OneStopProp’s program structure offers accounts from $10K to $300K with scaling options reaching up to $1.2M, positioning it among the better-capitalized retail programs in 2026. Pro Account holders receive a 100% profit split on the first 5 payouts, then 90/10 after that, with payouts available every 5 days after a first payout that requires a minimum of 8 trading days. The funded account covers stocks including the full Magnificent 7, Apple (AAPL), NVIDIA (NVDA), Microsoft (MSFT), Amazon (AMZN), Alphabet/Google (GOOGL), Meta (META), and Tesla (TSLA), alongside forex and crypto, all tradable from a single account with TradingView-powered charts.
If your TradingView setup is ready and your backtest is calibrated, you can start your OneStopProp challenge today.
Common Mistakes Traders Make Using TradingView in Prop Firm Challenges
Overloading the Chart with Indicators
There are no universal indicators that work perfectly for all cases and all traders. Finding the right tools takes time, explore several, configure their settings, and find the ones that best match your unique trading style. Adding 8 indicators to a chart does not create 8x clarity; it creates noise. Traders who chase confirmation from too many tools take entries late, widen stops unnecessarily, and consistently underperform their own backtests.
Ignoring the Prop Firm’s Specific Drawdown Mechanics
Rule sets vary between firms and change over time, verify every rule against your firm’s current terms, particularly the drawdown type and any consistency requirement. A TradingView backtest built against a static drawdown model will give misleading results if your firm uses a trailing drawdown mechanism. Always confirm whether drawdown is measured from the initial balance (static) or from your peak equity (trailing) before you build your risk parameters.
Not Saving Chart Templates Between Sessions
Every prop firm evaluation has a clock, not always a calendar deadline, but an opportunity cost. Time spent rebuilding your workspace is time away from analyzing the market. TradingView’s charting tool is very user-friendly, with each feature clearly labeled and an intuitive process for adding, removing, and saving charts. Use that save function religiously.
Frequently Asked Questions
What TradingView plan do I need for prop firm stock analysis?
It depends on how many charts you want open at once, and that is the honest answer for TradingView stock analysis prop firm work. Essential, at $14.95 a month, gives you 2 charts per tab and 20 price alerts, which works if you rotate timeframes instead of watching 3 at once. Plus, at $34.95 a month, gives you 4 charts per tab and 100 alerts, which is what the 3-panel workspace needs.
The free Basic plan is 1 chart per tab: fine for learning, thin for a live challenge. Real-time US stock data is billed separately as exchange data, whichever plan you pick.
Can I use custom Pine Script indicators during my prop firm challenge?
Traders can generally use TradingView’s built-in indicators as well as custom indicators created with Pine Script. However, indicator availability may vary depending on how the prop firm’s integration is configured. Confirm with your specific firm before building a strategy around a custom script.
How do I use TradingView to stay within daily drawdown limits?
Set price-level alerts on every open position at your maximum loss threshold before the session begins. The single most useful script for a challenge account is a risk/reward position-sizing tool that draws entry, stop, and target on one chart and outputs position size from your risk in currency. Knowing your exact loss-to-limit ratio on screen at all times prevents the emotional decisions that lead to drawdown breaches.
Should I use TradingView differently for stocks versus forex in a prop firm challenge?
Filter recipes change by trading style: day traders lead with volume, RVOL, and ATR; swing traders lead with EMA stacks and weekly RSI; longer-term traders lead with fundamentals. For stocks like MSFT or AMZN, volume and VWAP are critical intraday anchors. For forex pairs, session-based indicators and daily pivot levels tend to be more relevant given the 24-hour market structure.
What is the AI Chart Copilot feature in TradingView and should I use it?
AI Chart Copilot is a free Chrome extension in public beta, with a 15-request daily limit. Unlike the document and news features built into TradingView, it reads your current chart state, including the active symbol, timeframe, indicators, and visible price range. It can be useful for reviewing setups and checking your analysis logic, but treat it as a sounding board rather than a signal generator, prop firm evaluations reward your own disciplined process, not outsourced decision-making.
Sources
- TradingView Review 2026, StockBrokers.com. Features, pricing, and charting capabilities reviewed. https://www.stockbrokers.com/review/tools/tradingview
- TradingView AI Features Explained, TradersPost Blog. Coverage of AI Chart Copilot and 2026 AI feature launches. https://blog.traderspost.io/article/tradingview-ai-features-chart-copilot-documents-news
- TradingView Review 2026: Charts and Screening Tools Tested, GreatWorkLife. Independent review from a Certified Financial Technician. https://www.greatworklife.com/tradingview-review/
- Best Prop Firms for TradingView, Myfxbook. Overview of TradingView integration types at prop firms. https://www.myfxbook.com/prop-firms/platforms/tradingview
- 12+ Best Prop Firms That Use TradingView, AquaFunded. Integration model breakdown and payout tracking data. https://www.aquafunded.com/blogs/prop-firms-that-use-tradingview
- I Tested 103 Free TradingView Indicators, LiberatedStockTrader. Ranked list of top TradingView indicators. https://www.liberatedstocktrader.com/best-tradingview-indicators/
- Multi-Timeframe Trading with Indicators, Excavo. Full 2026 framework for multi-timeframe stock analysis. https://excavo.com/blog/multi-timeframe-trading-indicators
- TradingView Multi-Chart Layout Guide, Supa.is. Step-by-step setup for multiple timeframe analysis. https://supa.is/article/tradingview-multi-chart-layout-multiple-timeframes-setup-2026
- Modeling Prop Firm Trailing Drawdown in Pine Script, DEV Community. Technical guide to encoding drawdown rules in TradingView backtests. https://dev.to/just-a-guy360/modeling-prop-firm-trailing-drawdown-in-pine-script-so-your-backtest-stops-lying-2n7e
- Pine Script Strategies Documentation, TradingView. Official documentation on strategy scripts and Strategy Tester. https://www.tradingview.com/pine-script-docs/concepts/strategies/
- TradingView Scripts Every Funded Trader Should Know, For Traders. Risk guard scripts and position sizing tools for challenge accounts. https://fortraders.com/blog/tradingview-scripts-funded-trader-know
- Day Trader’s Guide to Using TradingView’s Market Screener, TradersLog. Screener setup and filter strategies for active traders. https://www.traderslog.com/screener-day-trading
- Prop Firm Statistics 2026, The Chart Whisperer. Market size data, drawdown failure rates, and payout statistics. https://chartwhisperer.ca/prop-firm-statistics
- Prop Trading Industry Report 2026, Track360. Market expansion data from $450M to $850M. https://track360.io/blog/prop-trading-industry-report-2026-market-analysis
- Prop Firm Trading Without Time Limits, OneStopProp. Overview of challenge structure and drawdown rules. https://onestopprop.com/prop-firm-trading-without-time-limits/
- How Much Capital Can You Get From a Prop Firm, OneStopProp. Account tiers, scaling paths, and capital allocation data. https://onestopprop.com/how-much-capital-can-you-get-from-a-prop-firm/
- TradingView Stock Screener, TradingView Official. Feature documentation for the stock screener. https://www.tradingview.com/support/solutions/43000718866-tradingview-stock-screener-trade-smarter-not-harder/
- TradingView Indicators Guide, TradingView Official. Getting started with indicators and Pine Script. https://www.tradingview.com/support/solutions/43000543626-tradingview-indicators-simple-steps-to-get-started/