The forex market processes over $9.51 trillion in daily trading volume, yet the vast majority of retail participants still walk away from the market with losses. According to research compiled by For Traders, the percentage of day traders who lose money sits between 74% and 97% depending on market, timeframe, and how “losing” is defined. That gap between the market’s opportunity and traders’ actual outcomes almost always comes down to the same root cause: poor risk management.
The traders who ignore risk management face a compounding problem. As vocal.media’s analysis of risk mismanagement shows, a single oversized trade can erase weeks of steady progress, and traders who ignore risk limits frequently overtrade in an attempt to recover losses quickly, creating a destructive cycle that destroys both capital and confidence. The good news is that the right tools transform risk management from a vague concept into a concrete, repeatable process.
This guide covers the 7 best risk management tools traders should have in their stack in 2026, ranked by impact and accessibility, with honest coverage of each one.

Key Takeaways
- Risk determines survival, strategy determines edge: For Traders’ data-driven analysis shows that the failure mode in funded evaluations is “almost never strategy, it’s risk management under pressure.” Fix the risk process first.
- The 1-2% rule is the baseline standard: FX News Group’s 2025 report on experienced traders confirms most now limit risk to 1-2% of total capital per trade. If you are risking more, reduce immediately.
- Journaling compounds returns: Tradervue’s platform research cited by TradeAlgo shows traders who journal consistently for 6 months improve their risk-adjusted returns by an average of 32%. Start logging every trade, every day.
- R:R ratio matters more than win rate: TradeZella’s risk-reward guide explains that with a 1:3 R:R ratio, you only need to win 25% of trades to break even, meaning you can be wrong 3 out of 4 times and still avoid losses.
- Prop firm structures enforce discipline: Structured environments with hard drawdown rules eliminate the discretionary decision to “just this once” break your own limits, a behavioral advantage that self-funded traders rarely replicate consistently.
Quick-Start Prioritization Framework
| Tool | Best For | Effort Level | Time to Results |
|---|---|---|---|
| OneStopProp funded account | Traders who want built-in risk rules + funded capital | Low setup | Immediate (rules enforced automatically) |
| Position Size Calculator | Every trader before every trade | Very Low | Instant per trade |
| Stop-Loss Orders | Active traders in volatile markets | Low | Instant per position |
| Risk/Reward Calculator | Traders filtering bad setups before entry | Low | Instant per trade |
| Trading Journal | Traders building a long-term edge | Medium | 30-90 days |
| Economic Calendar | News-aware and forex traders | Low | Before each session |
| Drawdown Tracker | Prop firm traders and performance-focused traders | Medium | Weekly review |
Start here based on your situation:
- New to trading: Start with a position size calculator and stop-loss orders. These 2 tools alone prevent the most common account-killing mistakes.
- Intermediate trader with a strategy: Add a trading journal and risk/reward calculator to identify where your edge actually lives, and where it does not.
- Serious trader or prop firm aspirant: Use all 7, with OneStopProp’s funded account as the environment that ties the risk rules together with real funded capital.
1. OneStopProp: Best Overall Risk Management Environment
Best for: Traders who want a structured, rule-enforced risk environment with access to funded capital across stocks, forex, and crypto.
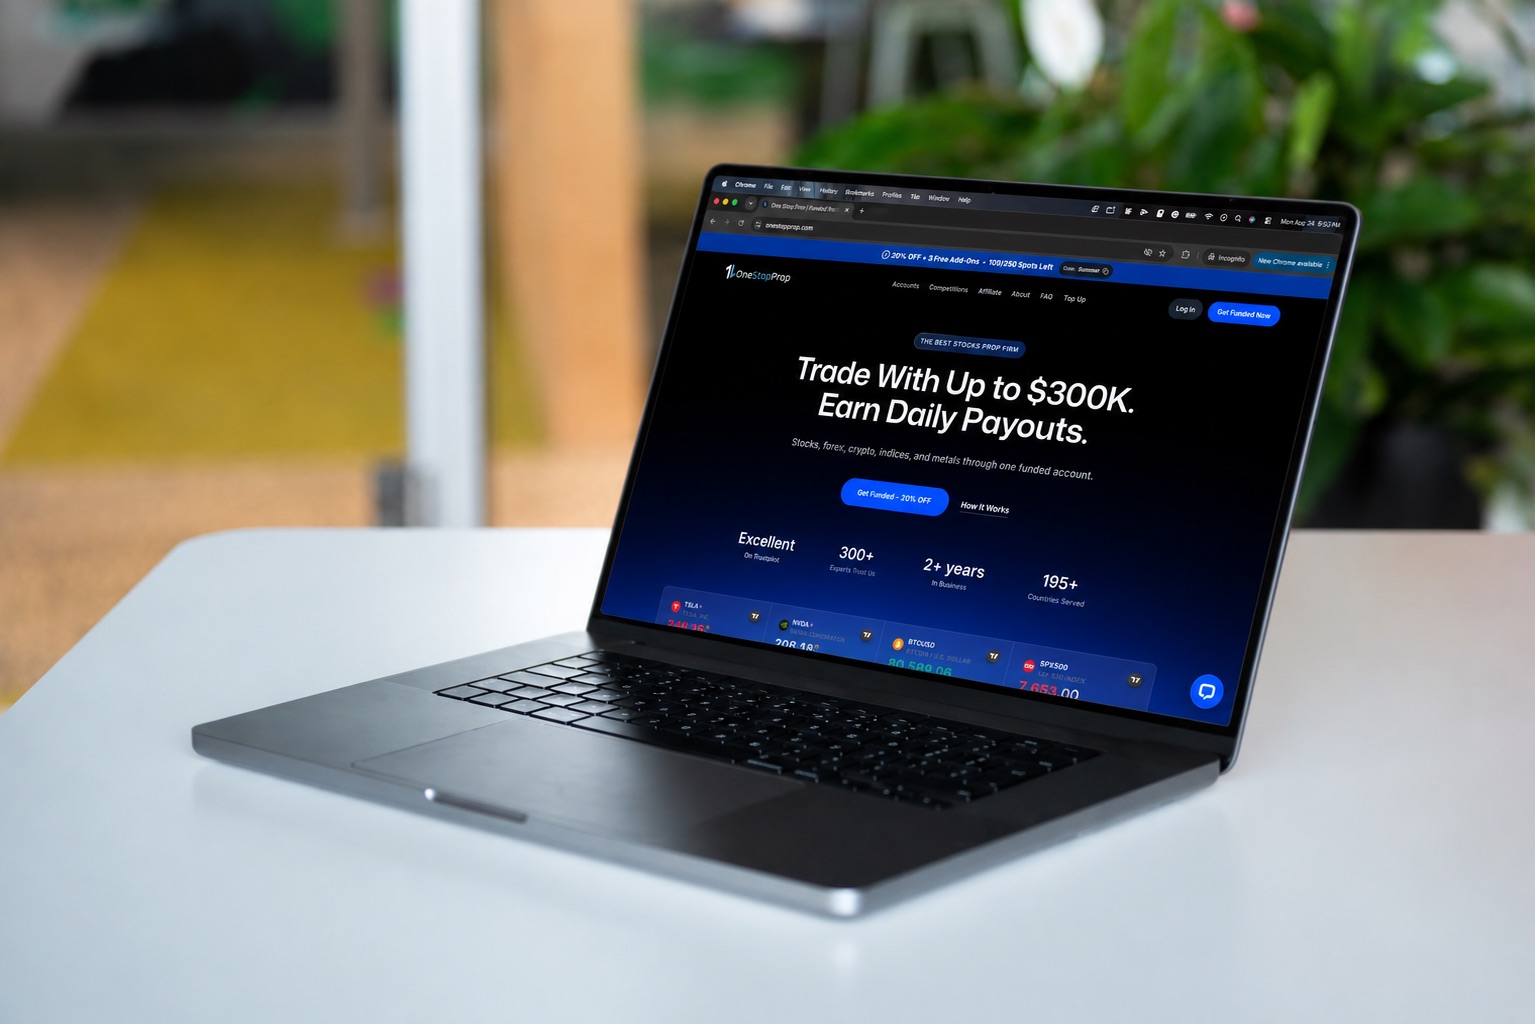
When you trade your own account, the rule to “never risk more than 1%” is voluntary. In practice, most traders break it under emotional pressure. A OneStopProp account changes that dynamic entirely, the risk rules are structurally enforced, not aspirational.
OneStopProp offers funded trading accounts covering stocks, forex, and crypto in a single account structure, with up to $300,000 in capital access and 6 account sizes to choose from. These accounts deliver a 90% base profit split, which can be raised to 95% for the life of the account with the Lifetime Profit Split 95% Add-On, one of the highest available profit splits in the prop firm space in 2026. The challenge structure uses clear daily loss limits and maximum drawdown rules, which function as the same stop-loss and risk controls this article recommends, except they are automatic, not discretionary.
In my experience helping traders understand funded accounts, the single biggest benefit of a structured prop environment is the removal of “just this once” thinking. The platform simply does not allow it.
Pros:
- Risk limits (daily drawdown, max drawdown) are enforced automatically, not left to trader discipline
- Trades across stocks, forex, and crypto within a single funded account
- 90% base profit split, raised to 95% for the life of the account with the Lifetime Profit Split 95% Add-On
- Simple, transparent rules with no hidden fees or activation charges
- Fast payouts and multi-asset flexibility give traders real operational freedom
Cons:
- Requires passing a challenge evaluation before accessing funded capital
- The structured environment means rule breaches result in account resets, not just losses
Pro Tip: Treat every funded evaluation phase as a live risk management test, not just a hurdle to clear. The habits you build during the evaluation, consistent position sizing, disciplined stop placement, respecting daily limits, are exactly the habits that generate sustainable payouts. Check the OneStopProp help center for the specific drawdown thresholds on your chosen account tier before you place your first trade.
2. Position Size Calculator: Best Tool for Eliminating Oversized Trades
Best for: Every trader, every asset class, before every trade is placed.
According to Chart Guys’ position sizing guide, calculating position size involves dividing your risk per trade by the risk per share, and understanding this calculation is the first step toward making informed trading decisions. BabyPips’ position size calculator frames it clearly: proper position sizing is key to managing risk and avoiding blowing out your account on a single trade.
The math behind position sizing is straightforward. If you have a $10,000 account and want to risk 1% per trade, your dollar risk is $100. If your stop-loss is $2 away from your entry price, you can buy a maximum of 50 shares. Capital Companion’s position calculator illustrates this exact formula: Dollar Risk / Risk Per Share = Maximum Shares.
Most risk management frameworks suggest risking 1-2% of account equity per trade so a normal losing streak cannot severely draw down the account. If you are currently risking more than 2% per trade, recalibrate immediately using a calculator before your next session.
Pros:
- Free tools available across multiple platforms (BabyPips, TraderLion, EBC Financial Group)
- Works across all asset classes, stocks, forex, futures, crypto
- Removes guesswork and prevents emotional oversizing
Cons:
- Only as effective as the stop-loss placement it is paired with
- Requires discipline to use before every single trade, not just occasionally
3. Stop-Loss Orders: Best Tool for Capping Downside Automatically
Best for: All traders in all markets, but especially active traders in volatile or fast-moving conditions.
Why Stop-Losses Outperform Manual Exits
Saxo Bank’s guide to stop-loss orders defines the core function cleanly: a stop-loss is an instruction to sell (for a long position) or buy (for a short position) if the price reaches a specified level, helping manage risk by limiting losses when trades move against you. The key advantage over manual exits is psychological.
Finance Invest Scope’s research on stop-losses in trading puts it directly: “By automating your exit strategy, a stop-loss order removes the emotional weight of trading and ensures that a single bad trade does not lead to financial ruin.” Experienced traders understand that protecting capital matters more than chasing gains. The stop-loss is the primary tool for that protection.
Types of Stop-Loss Placements
Technical analysis-based stops are placed just below established support levels. If price breaks through support, the original thesis is invalidated. Percentage-based stops use a fixed percentage loss, such as 2% of total account value, ensuring no single trade can jeopardize a significant portion of capital.
Pro Tip: Yahoo Finance’s breakdown of stop-loss mechanics notes that stop-losses “remove emotional decision-making” and allow traders to set exit points in advance, avoiding impulsive decisions driven by fear or greed. Pair every stop-loss placement with your position size calculation, if your stop is too wide, size down. Never widen the stop to accommodate an oversized position.
Pros:
- Automates risk management so positions do not require constant monitoring
- Eliminates emotional override of planned exit levels
- Protects capital in fast or overnight markets
Cons:
- Subject to slippage in fast-moving markets, execution price may differ from the stop price
- Tight stops placed without accounting for normal volatility can trigger premature exits
4. Risk/Reward Calculator, Best Tool for Filtering Out Bad Trades Before Entry
Best for: Traders who want to pre-qualify every trade mathematically before committing capital.
The Math That Separates Profitable Traders
TradeZella’s risk/reward ratio guide presents a critical insight: win rate is often the wrong thing to optimize. A trader with a 40% win rate and a 1:3 R:R will make more money over time than a trader with an 80% win rate and a 1:0.5 R:R. The math always favors better risk-to-reward, even with fewer winning trades.
FBS’s forex risk management guide identifies the ideal R:R ratio for traders as 1:2 or 1:3 minimum, meaning for every dollar risked, a trader should earn $2 or $3. At a 1:3 ratio, just 2 winning trades cover 10 losses. That is a mathematical edge most traders ignore entirely.
Colibri Trader’s risk/reward calculator guide explains the behavioral shift: “By using a risk/reward ratio calculator, you turn wishy-washy market predictions into cold, hard numbers, forcing you to ask the most important question: is this trade actually worth the risk?” That forced discipline filters out a large percentage of low-quality trades that look attractive in the moment.
Benchmark: If your average R:R across your last 20 trades is below 1:1.5, your strategy is mathematically compromised regardless of how good your entries feel. Run the numbers before your next session.
Pros:
- Filters low-quality, low-reward trades before capital is at risk
- Helps maintain positive expectancy over large sample sizes
- Free calculators available at TradeZella, ForexBrokersVerified, and Colibri Trader
Cons:
- The ratio is a plan, not a guarantee, target levels still need to be based on real price structure
- Moving stops to “improve” the ratio after entry defeats the purpose entirely
5. Trading Journal: Best Tool for Turning Raw Data Into Behavioral Change
Best for: Any trader serious about improving performance over a 30-to-90-day horizon.
Why Journaling Improves Risk-Adjusted Returns
Tradervue’s platform research, referenced by TradeAlgo’s day trading journal guide, found that traders who journal consistently for 6 months improve their risk-adjusted returns by an average of 32%. Journaling converts random trading activity into a measurable feedback loop.
UltraTrader’s study of 5,000 accounts reveals a counterintuitive finding: journalers had a lower raw win rate than non-journalers (44.5% vs 53.2%), but the journaling group was making money while the non-journaling group was not. The difference came from R:R, drawdown control, and expectancy, the metrics that actually determine profitability.
CapTrader’s trading journal guide identifies the core mechanism: by regularly analyzing your trades, you can identify patterns and trends that help you adjust and refine your strategy. Keeping a journal forces you to trade in a disciplined and systematic way, which leads to better long-term results.
Top Journal Platforms in 2026
- TradeZella, 50+ built-in reports, Prop Firm Sync for funded accounts, best for multi-account traders
- Tradervue, 100+ advanced reports, mentor sharing layer, import from 80+ brokers
- Trademetria, strong options-specific tracking, integrates with most major platforms
Pro Tip: For Traders’ journaling guide notes that traders who review journals regularly report “cutting losing setups, sizing up on proven edges, and reducing revenge-trading episodes, because the data makes emotional decisions visible and hard to ignore.” Commit to logging every trade for 30 days minimum before evaluating whether the process is working.
Pros:
- Surfaces behavioral patterns invisible to real-time observation
- Identifies your most and least profitable setups by setup type, time of day, and market condition
- Reduces revenge trading and emotional overrides by making patterns data-visible
Cons:
- Requires consistent input to generate meaningful data, inconsistent use produces misleading insights
- Results take 4-8 weeks to materialize; initial setup feels slow
6. Economic Calendar: Best Tool for Managing Event-Driven Risk
Best for: Forex traders, day traders, and any trader with open positions heading into major news releases.
Why Traders Cannot Afford to Trade Blind Into News
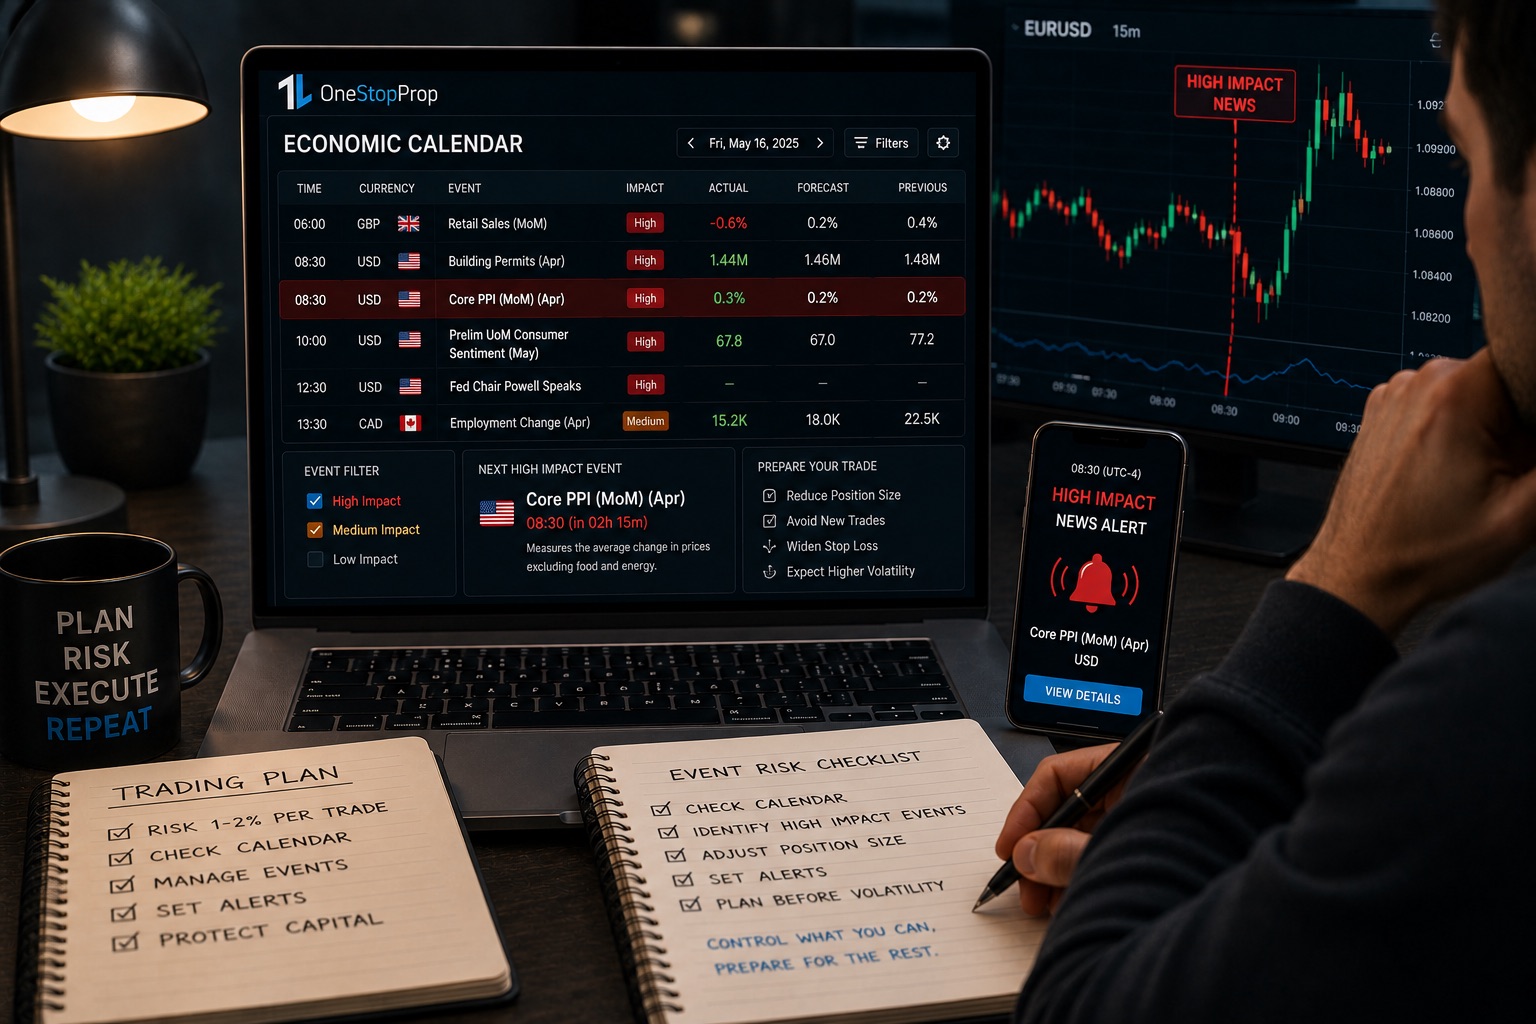
The tastyfx guide to economic calendars defines the tool precisely: an economic calendar tracks important scheduled events related to economic data and announcements that could affect financial markets. For forex traders specifically, high-importance events, like Federal Reserve decisions, Non-Farm Payrolls, and CPI releases, can generate volatility spikes that invalidate even well-placed stop-losses through slippage.
HYCM’s analysis of economic calendar events confirms that volatility spikes during major announcements can lead to price gaps, slippage, and increased spreads, requiring traders to use proper risk management strategies around economic events. Knowing the timing allows traders to either reduce position size ahead of the release, widen stops to account for the expected volatility, or simply step aside until the data resolves.
BabyPips recommends checking the economic calendar every day, before trading begins in the morning, and again at the end of the day to prepare for the following session. High-impact events may cause volatile market conditions, and being blindsided by a scheduled release while holding an unprotected position is an entirely avoidable risk.
Best free calendars: Investing.com’s economic calendar, TradingView’s economic calendar, and Forex Factory all provide real-time data with impact ratings.
Pros:
- Free on all major platforms
- Prevents being caught off-guard by scheduled volatility
- Allows proactive position sizing adjustments before high-risk events
Cons:
- Markets sometimes react counter to expectations, a calendar prevents surprise, not volatility itself
- Requires daily habit formation; occasional users forget to check during busy sessions
7. Drawdown Tracker: Best Tool for Preserving Capital During Losing Streaks
Best for: Prop firm traders managing hard drawdown limits, and any trader who wants to avoid the deepest psychological and financial damage of uncontrolled losing streaks.
Measuring the Metric That Determines Survival
TradeZella’s performance analysis guide defines maximum drawdown as the largest peak-to-trough decline in account equity during a specific period. The benchmark for personal accounts is to keep max drawdown under 15%; for prop firm accounts, most firms set hard limits at 5% to 10%. A system with a 1.5 profit factor but 25% max drawdown is almost untradeable psychologically, even though it is technically profitable.
TradeAlgo’s research on trading risk tools notes that most prop firms set daily limits at 1-3% and maximum drawdown at 5-10% before mandatory review. Tracking your drawdown in real time, not just checking your account balance, tells you when to reduce size, take a break, or step away entirely. Those are decisions that protect capital when emotions are pushing in the opposite direction.
UltraTrader’s 5,000-account study found that crypto journalers with a documented rule for maximum position size were “far less likely to violate it in a fast-moving market,” and the drawdown gap between journalers and non-journalers (5.2% vs 11.4%) was almost entirely explained by one behavior: over-leveraging into volatile setups with no written pre-trade criteria.
Benchmark: If your drawdown exceeds 5% in a single week, stop trading for the rest of that week. Review your journal. Identify the specific trades that broke the model. Return to the market with reduced size the following week.
Pros:
- Provides an early warning system before losses reach account-threatening levels
- Especially critical for prop firm accounts where exceeding the limit ends the challenge
- Most journal platforms (TradeZella, Tradervue, Trademetria) include built-in drawdown dashboards
Cons:
- A drawdown tracker measures the problem; the response to the data still requires trader discipline
- Real-time drawdown visibility can increase psychological pressure during normal drawdown periods
Common Mistakes When Traders Ignore Risk Management
Most traders who ignore risk management do not do so consciously. They do it incrementally, one slightly oversized trade, one stop they decide to move “just this once,” one news event they forgot to check before entry.
Vocal Media’s analysis captures the slow-burn reality: “small miscalculations compound, and eventually, the trading account reflects the accumulated impact.” The failure accumulates invisibly until a single session reveals how far the account has drifted from its starting point.
The 7 tools above address each failure mode with a specific countermeasure:
- Oversized positions, Position Size Calculator
- Uncapped losses, Stop-Loss Orders
- Low-quality trade selection, Risk/Reward Calculator
- Blind entry into news events, Economic Calendar
- Undetected behavioral patterns, Trading Journal
- Unmonitored losing streaks, Drawdown Tracker
- Discretionary rule-breaking, OneStopProp account (structural enforcement)
Frequently Asked Questions
What is the most important risk management tool for beginners?
A position size calculator paired with a stop-loss order is the most important combination for new traders. BabyPips’ position size calculator explains that proper sizing prevents account-destroying mistakes before they happen. Most beginners should risk no more than 1% of their account per trade until they have at least 50-100 documented trades to analyze.
How much should I risk per trade?
Most risk management frameworks recommend risking 1-2% of account equity per trade, so a normal losing streak cannot severely draw down the account. FX News Group’s 2025 report confirms that experienced forex traders now limit their risk to 1-2% per trade as standard practice. Beginners should target 0.5-1% until a proven track record is established.
Do prop firm accounts actually help with risk management?
Structured prop firm accounts enforce drawdown and daily loss limits automatically, removing the option to override your own rules under pressure. As OneStopProp’s funded account scaling guide notes, traders who maintain discipline during evaluation phases build the exact habits that generate consistent payouts. For Traders’ data confirms the failure mode in funded challenges is “almost never strategy, it’s risk management under pressure,” which the structural rules directly address. You can explore OneStopProp’s account and Add-On options at onestopprop.com/checkout.
What is a good risk/reward ratio for forex trading?
FBS’s forex risk management guide identifies 1:2 and 1:3 as the ideal starting benchmarks. At a 1:3 ratio, you only need to win 25% of trades to break even. TradeZella’s R:R research shows that a trader with a 40% win rate at 1:3 will outperform a trader with an 80% win rate at 1:0.5 over time. Target 1:2 as your absolute minimum, and filter out any setup that does not meet that threshold before entry.
How often should I review my trading journal for risk management?
CapTrader’s trading journal guide recommends regular and systematic review to identify weaknesses and continuously improve your trading strategy. At minimum, review your journal weekly, checking max drawdown, average R:R, and which setup types are generating losses. UltraTrader’s 5,000-account study found that by the 60-day mark, traders who journal consistently have internalized their behavioral patterns and the review process “stops being a post-trade chore and starts functioning as a real-time constraint.”
Sources
- Forex Trading Industry Statistics 2026, CompareForexBrokers. Daily forex volume and market size data. https://www.compareforexbrokers.com/trading/statistics/
- Why Poor Risk Management Quietly Destroys Trading Success, Vocal Media. Analysis of risk mismanagement behaviors. https://vocal.media/education/why-poor-risk-management-quietly-destroys-trading-success
- Leverage Fatigue: Why 2025 May Be the Year Forex Traders Prioritize Risk, FX News Group. Experienced trader risk habits. https://fxnewsgroup.com/forex-news/retail-forex/leverage-fatigue-why-2025-may-be-the-year-forex-traders-prioritize-risk-over-reward/
- Risk-Reward Ratio Guide 2026, TradeZella. Win rate vs R:R analysis. https://www.tradezella.com/blog/risk-reward-ratio
- Does a Trading Journal Improve Performance? Data from 5,000 Accounts, UltraTrader. Journaler vs non-journaler outcomes. https://blog.ultratrader.app/does-trading-journal-improve-performance/
- OneStopProp, Best Prop Firms for Stock Traders 2026, OneStopProp. Account and Add-On features and profit splits. https://onestopprop.com/best-prop-firms-for-stock-traders-in-2026/
- Position Size Calculator, BabyPips. Forex position sizing tool. https://www.babypips.com/tools/position-size-calculator
- Calculating Position Size, Britannica Money. Position size formula and methodology. https://www.chartguys.com/articles/position-sizing
- Position Size Calculator, Capital Companion. Risk framework and 1-2% rule. https://capitalcompanion.ai/tools/position-calculator/
- What is a Stop-Loss Order, Saxo Bank. Stop-loss mechanics and execution. https://www.home.saxo/learn/guides/trading-strategies/what-is-a-stop-loss-order
- The Importance of Stop-Loss Orders in Trading, Finance Invest Scope. Emotional management and stop-loss strategy. https://financeinvestscope.com/the-importance-of-stop-loss-orders-in-trading/
- Stop Loss Order: How It Works, Pros and Cons, Yahoo Finance. Stop-loss benefits and execution mechanics. https://finance.yahoo.com/news/stop-loss-order-works-pros-215402645.html
- Risk Management in Forex Trading, FBS. R:R ratios and forex risk strategy. https://fbs.com/fbs-academy/traders-blog/risk-management-in-forex
- Risk/Reward Ratio Calculator Guide, Colibri Trader. Behavioral and mathematical risk analysis. https://www.colibritrader.com/risk-reward-ratio-calculator-2/
- Trading Journal 2026: Advantages and Tools, CapTrader. Journal benefits for strategy improvement. https://www.captrader.com/en/blog/trading-journal/
- Economic Calendar: Macro Events, tastyfx. Economic calendar tool explanation. https://www.tastyfx.com/news/economic-calendar/
- Most Important Economic Calendar Events, HYCM. Volatility and event risk management. https://hycm.com/en/blog/forex-market-history/economic-calendar
- Forex Economic Calendar, BabyPips. Daily calendar use recommendation. https://www.babypips.com/economic-calendar
- How to Analyze Your Trading Performance, TradeZella. Max drawdown benchmarks and metrics. https://www.tradezella.com/blog/analyze-trading-performance
- OneStopProp Funded Account Scaling Plan, OneStopProp. Account, Add-On, and scaling structure. https://onestopprop.com/funded-account-scaling-plan/