Managing risk inside a prop firm account is a different challenge from managing risk in a personal brokerage account. The rules are harder, the consequences are immediate, and the margin for error is narrower. Research indicates that 95% of proprietary trading firm account failures result from poor risk management rather than flawed strategies. That single statistic reframes the entire challenge. Strategy is important, but it plays a supporting role. The primary job of any funded stock trader is to protect capital while building a record of disciplined, consistent performance.
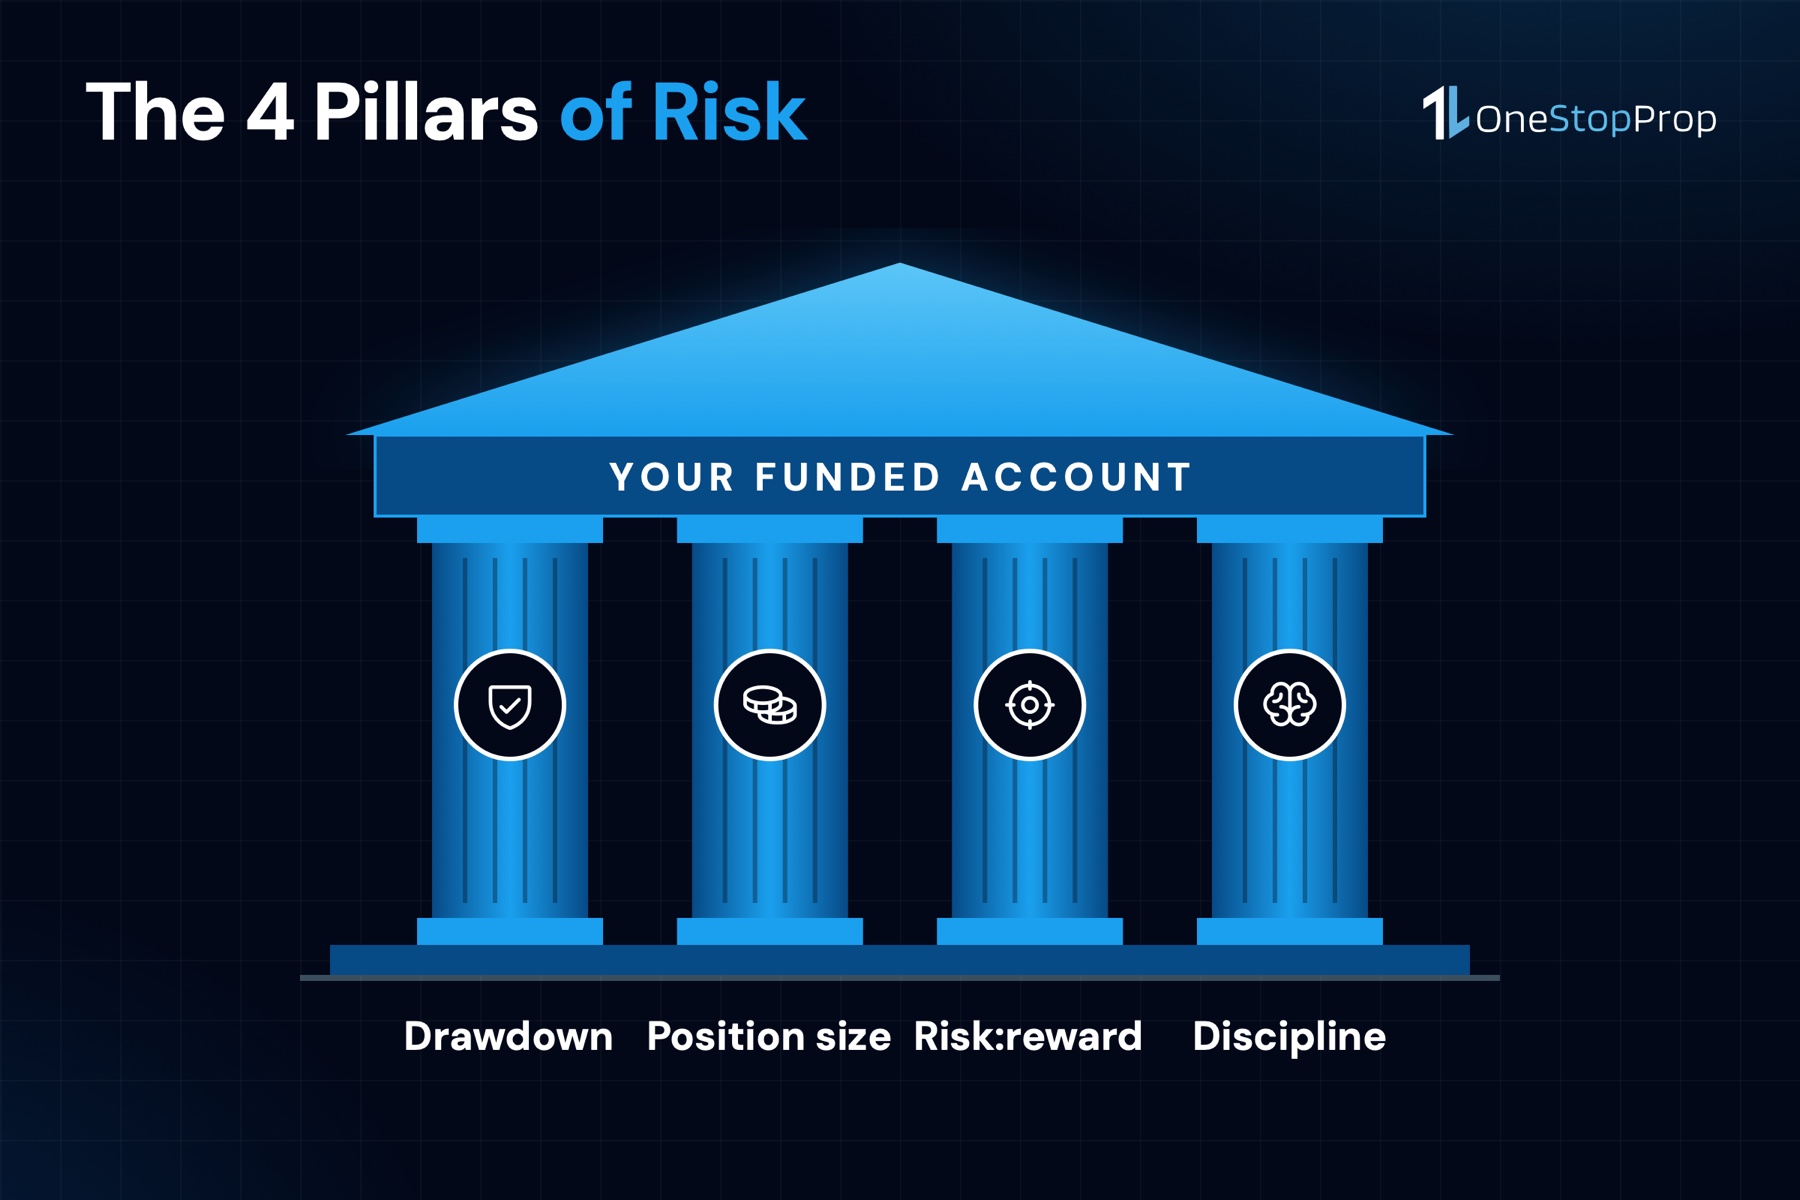
This guide breaks down every major pillar of prop firm risk management for stock traders, drawdown rules, position sizing, risk-reward ratios, and the psychological discipline that holds everything together.
Key Takeaways
- Poor risk management ends most accounts: About 95% of evaluation failures stem from poor risk management, not flawed strategies. Prioritize capital preservation above all else.
- Position sizing is the single most critical skill: Position sizing is the single skill that separates funded traders from failed challengers, how much you risk per trade determines whether you get funded and stay funded.
- Drawdown rules are automatic and unforgiving: Prop firm rules are the risk parameters a firm applies to a trading account during an evaluation and after funding. Most are enforced automatically by the platform, breach one and the account closes the same second.
- Risk-reward ratio requires a floor: A 1:2 risk-reward ratio is a widely adopted benchmark because it allows traders to be profitable even with a win rate below 50%, providing a robust framework for long-term consistency.
- The Magnificent 7 stocks carry elevated volatility: While the Magnificent 7 companies have factors that drove historical stock performances, these stocks have experienced high volatility in the past. Size positions in Apple (AAPL), NVIDIA (NVDA), Microsoft (MSFT), and their peers accordingly.
Quick-Start Prioritization Framework: Prop Firm Risk Management Stocks
| Risk Management Area | Best For | Effort Level | Time to Results |
|---|---|---|---|
| Learn your drawdown type (static vs. trailing) | All traders, Day 1 priority | Low | Immediate |
| Set position sizing formula | New and intermediate traders | Low | Within 1 week |
| Establish personal daily loss cap at 50% of firm limit | All traders | Low | Same day |
| Build risk-reward ratio filter | Intermediate traders | Medium | 2-4 weeks |
| Develop emotional discipline habits | All funded traders | High | 30-90 days |
| Correlation audit across stock positions | Experienced multi-position traders | Medium | 1-2 weeks |
Start here if you are:
- New to prop trading: Learn the drawdown type your firm uses before placing a single trade. Then set your position size formula and cap risk at 1% per trade or less.
- Returning after a blown account: Focus on the personal daily loss cap and emotional discipline sections first. The rules likely did not fail you, execution discipline did.
- An experienced trader scaling up: Run a full correlation audit across open positions in the Magnificent 7, as stocks like NVDA, MSFT, and AMZN tend to move together during broad tech selloffs, creating hidden risk concentration.
Understanding Prop Firm Drawdown Rules for Stock Traders
Every prop firm evaluation runs on 2 simultaneous loss limits. Every retail prop firm challenge runs on 2 simultaneous drawdown limits. Breach either one and you lose the account. Both are always active at the same time. Before you trade a single share of Apple (AAPL) or Tesla (TSLA), you need to know exactly which drawdown model your firm applies and how it is calculated.
Daily Drawdown Limit
Daily drawdown is the maximum loss your account is allowed to take in a single trading day. The moment your account hits or exceeds this limit, whether from closed trades, open floating losses, or both, trading is stopped and the account is usually terminated or locked. According to ForTraders’ 2026 prop firm rule analysis, typical daily loss limits sit at 4-6%, with maximum overall drawdown caps of 6-12%.
A critical and often overlooked detail: your daily drawdown limit is calculated from your total equity, including floating profits and losses on all open trades. A trade moving against you in real time counts immediately, even before you close it. This catches many stock traders off guard, particularly when holding volatile names like NVIDIA (NVDA) through a session.
Static vs. Trailing Drawdown
There are 3 distinct drawdown types, and each one requires a different approach to position sizing and risk management. Static drawdown has a fixed floor that never moves, the easiest to manage. Trailing drawdown follows your equity up, the hardest to manage, and where most traders get caught.
With a 5% maximum trailing drawdown on a $100k account, your initial limit is $95,000. If your balance hits $105,000, the trailing threshold moves up to $100,000. If you then hit a losing streak and the account drops to $99,999, you lose the account, even though you are technically around your initial balance. Because the threshold can move upward as the account reaches new highs, trailing drawdown models can reduce the available buffer after profitable trades.
The action: Know which type your firm uses before any trade. If the drawdown is trailing, reduce position sizes after strong winning days, your buffer has effectively shrunk.
Pro Tip: Set personal daily loss limits at 50% of your firm’s allowed threshold. This strategy will give you a safety margin and reinforce discipline. If your firm allows 5% daily loss, stop at 2.5%. Use platform alerts or automation to lock you out.
Position Sizing: The Formula That Keeps You Funded
Position sizing is the most important risk management decision you make on every single trade. This applies equally whether you are trading Alphabet (GOOGL), Amazon (AMZN), or Meta (META). The math is the same; only the volatility characteristics of each stock change.
The Core Position Sizing Formula
Position size = Risk Per Trade ($) / (Entry Price, Stop Price). This applies to every stock in your watchlist. The dollar risk per trade is the one variable you fully control.
As a concrete example: If you are trading NVIDIA (NVDA) with a $25,000 account, risking 1% ($250) per trade, and your stop is $3 below entry, your position size is 83 shares. Total exposure might be several thousand dollars, but your actual risk is capped at $250, well within the daily drawdown limit.
Most prop traders risk 0.5% to 1% per trade to protect their accounts and stay within drawdown limits. If you are closer to the 0.5% end, all the better. According to Audacity Capital’s position sizing guide, even a profitable strategy can fail without proper position sizing. Strategy gives you the edge; position size determines whether you survive long enough to benefit from it.
Why 1% Risk Can Still Be Dangerous
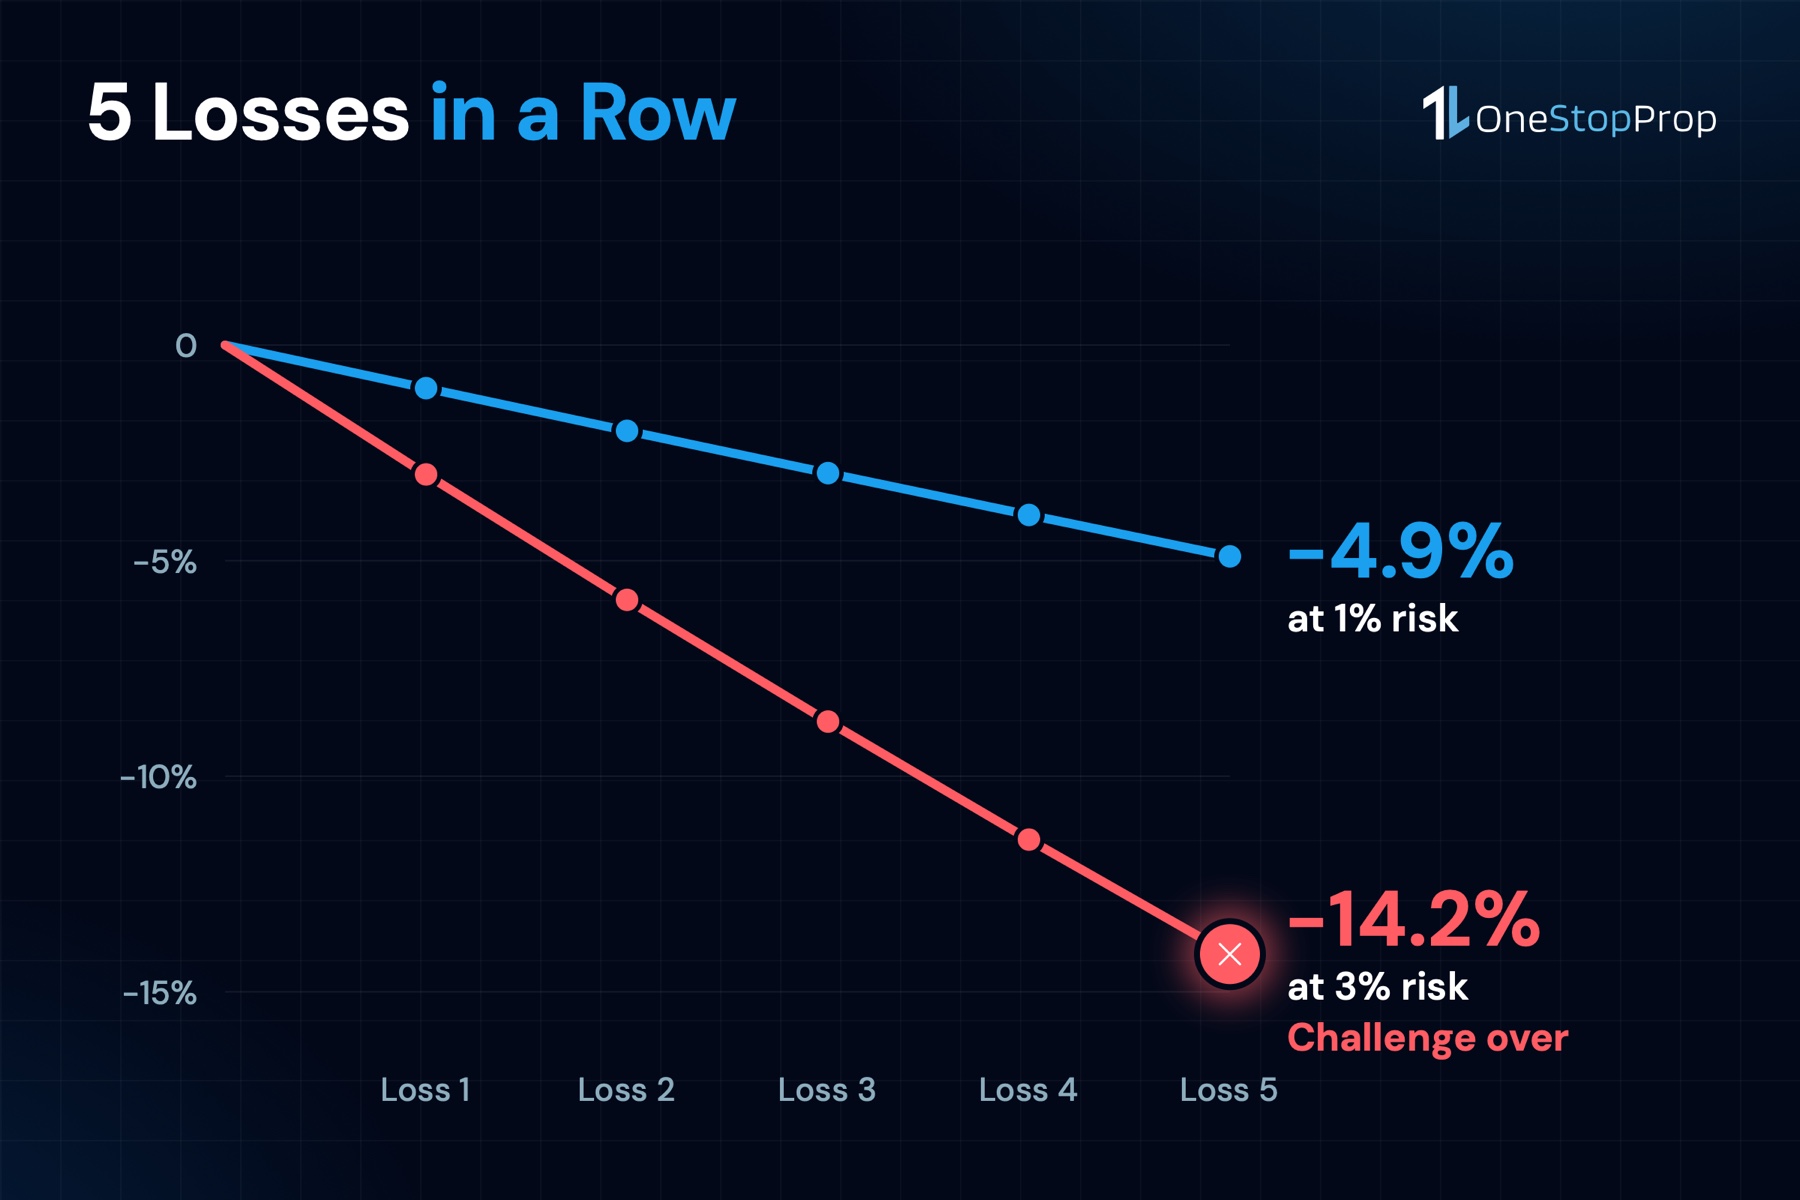
Risk 1% per trade on prop firm challenges, never 3%. At 3% risk, just 5 consecutive losses equals a -14.2% drawdown, challenge over. At 1%, the same streak equals -4.9%, survivable.
The math gets more specific when you add daily limits. Consider a trader risking 2% per trade on a $100,000 challenge. Each loss costs $2,000. 3 consecutive losses on a single session equals $6,000, above the $5,000 (5%) daily loss limit. 3 bad trades in one morning and the challenge is over, regardless of whether the strategy is sound long-term.
Pro Tip: A practical planning range for many traders is 0.25%-0.50% of the account reference amount per trade. Treat 1% as a high-risk setting that requires strong evidence from your losing-streak and failure-buffer calculations, not as the default rule.
Risk-Reward Ratio: Surviving With a Below-50% Win Rate
Risk-reward ratio is the relationship between your maximum loss on a trade and your target gain. A 1:2 ratio means risking 1 unit to make 2, and it only needs a 33.3% win rate to break even before costs. This matters enormously for stock traders, because even the best setups on names like Microsoft (MSFT) or Amazon (AMZN) do not produce winning trades more than 50-60% of the time over a large sample.
Why 1:2 Is the Practical Floor
At a 1:2 risk-reward ratio, you can lose 2 out of every 3 trades and still break even. At 1:3, you can lose 3 out of 4 trades and still not lose money. That buffer matters inside prop firm evaluations where losing streaks are normal events, not exceptions.
Most traders lose not because they pick bad setups, but because their risk-reward ratio is too low to survive a realistic win rate. The 1:2 ratio is the floor, not the ceiling.
Applying the Ratio to Stocks
The formula: R:R = (Entry Price, Stop Loss) ÷ (Take Profit, Entry Price). Every trade you take on a stock, whether it is Apple (AAPL) breaking above a key level or Meta (META) pulling back to the 20-day moving average, should pass this filter before you enter.
According to Dolvero’s risk-reward analysis, the 1:2 threshold is commonly cited as a minimum because it creates meaningful buffer against realistic trading imperfections, including the spread, commissions, and the psychological pressure that causes traders to exit winning trades too early.
The action: Calculate your R:R before entering any trade. If the ratio is below 1:2, skip the trade or wait for a tighter entry that improves the math.
Volatility and the Magnificent 7
Apple’s annualized price volatility typically runs around 25% to 30%, compared to roughly 15% to 20% for the broad S&P 500. Names like Tesla (TSLA) run even wider daily ranges. This means stop distances on Magnificent 7 stocks are naturally wider, so the same dollar risk requires a smaller share count. Do not use the same number of shares across all positions, use the same dollar risk and let the stop distance determine size.
Managing Correlated Stock Positions
One of the most underappreciated risks in prop firm stock trading is correlation. Correlation risk is the hidden danger that makes traders think they are diversified when they are actually doubling down on the same bet. If you are long on 2 correlated positions at the same time, you do not have 2 independent positions. You have 1 leveraged bet on the same directional outcome.
The Magnificent 7 accounted for 33.9% of the S&P 500 in September 2026, according to data sourced from Stock Analysis. This concentration means that Apple (AAPL), NVIDIA (NVDA), Microsoft (MSFT), Amazon (AMZN), Alphabet (GOOGL), Meta (META), and Tesla (TSLA) often move together during broad market events, tariff announcements, Federal Reserve decisions, or major earnings surprises. A trader holding positions in 3 or 4 Magnificent 7 stocks simultaneously may believe they are diversified. In a risk-off selloff, they are not.
The Correlation Audit
Before the trading day begins, check whether your planned positions share a directional bias. If all open stock trades benefit from the same market condition (for example, a broad tech rally), your actual risk is larger than the sum of individual position sizes suggests.
The action: Cap your total stock exposure from correlated positions at your daily loss limit, not each individual position separately. If your daily limit is $1,500 and you have 3 highly correlated positions, each position should be sized as if it is 1/3 of your total daily budget.
Pro Tip: Chris Rush, investment manager at IBOSS, highlighted that the biggest risk investors and traders were taking was being “too concentrated in the winners of the past.” “It is easy to focus on the short-term noise. With U.S. equities already making up such a large proportion of portfolios, concentration is a bigger risk.” For stock traders in funded accounts, this is an active, session-level concern, not a long-term portfolio concern.
Trading Psychology: The Invisible Risk Factor
Technical rules are straightforward to learn. Following them under pressure is the harder problem. Prop firm trading introduces psychological stressors that retail trading does not. You are trading someone else’s capital with hard rules that can end your account in a single moment of poor judgment.
Common Psychological Traps in Stock Trading
Even skilled traders can struggle if emotions like fear, greed, and frustration take control. The most damaging behaviors include overtrading to recover from losses, violating daily loss or drawdown limits, and abandoning strategies after a losing streak.
Research suggests sleep deprivation reduces prefrontal cortex function by 30-40%, directly impairing risk assessment and impulse control. Therefore, physical preparation, sleep, nutrition, and reducing pre-market stress, is not a soft-skill suggestion. It is a measurable risk management input.
Building Emotional Discipline
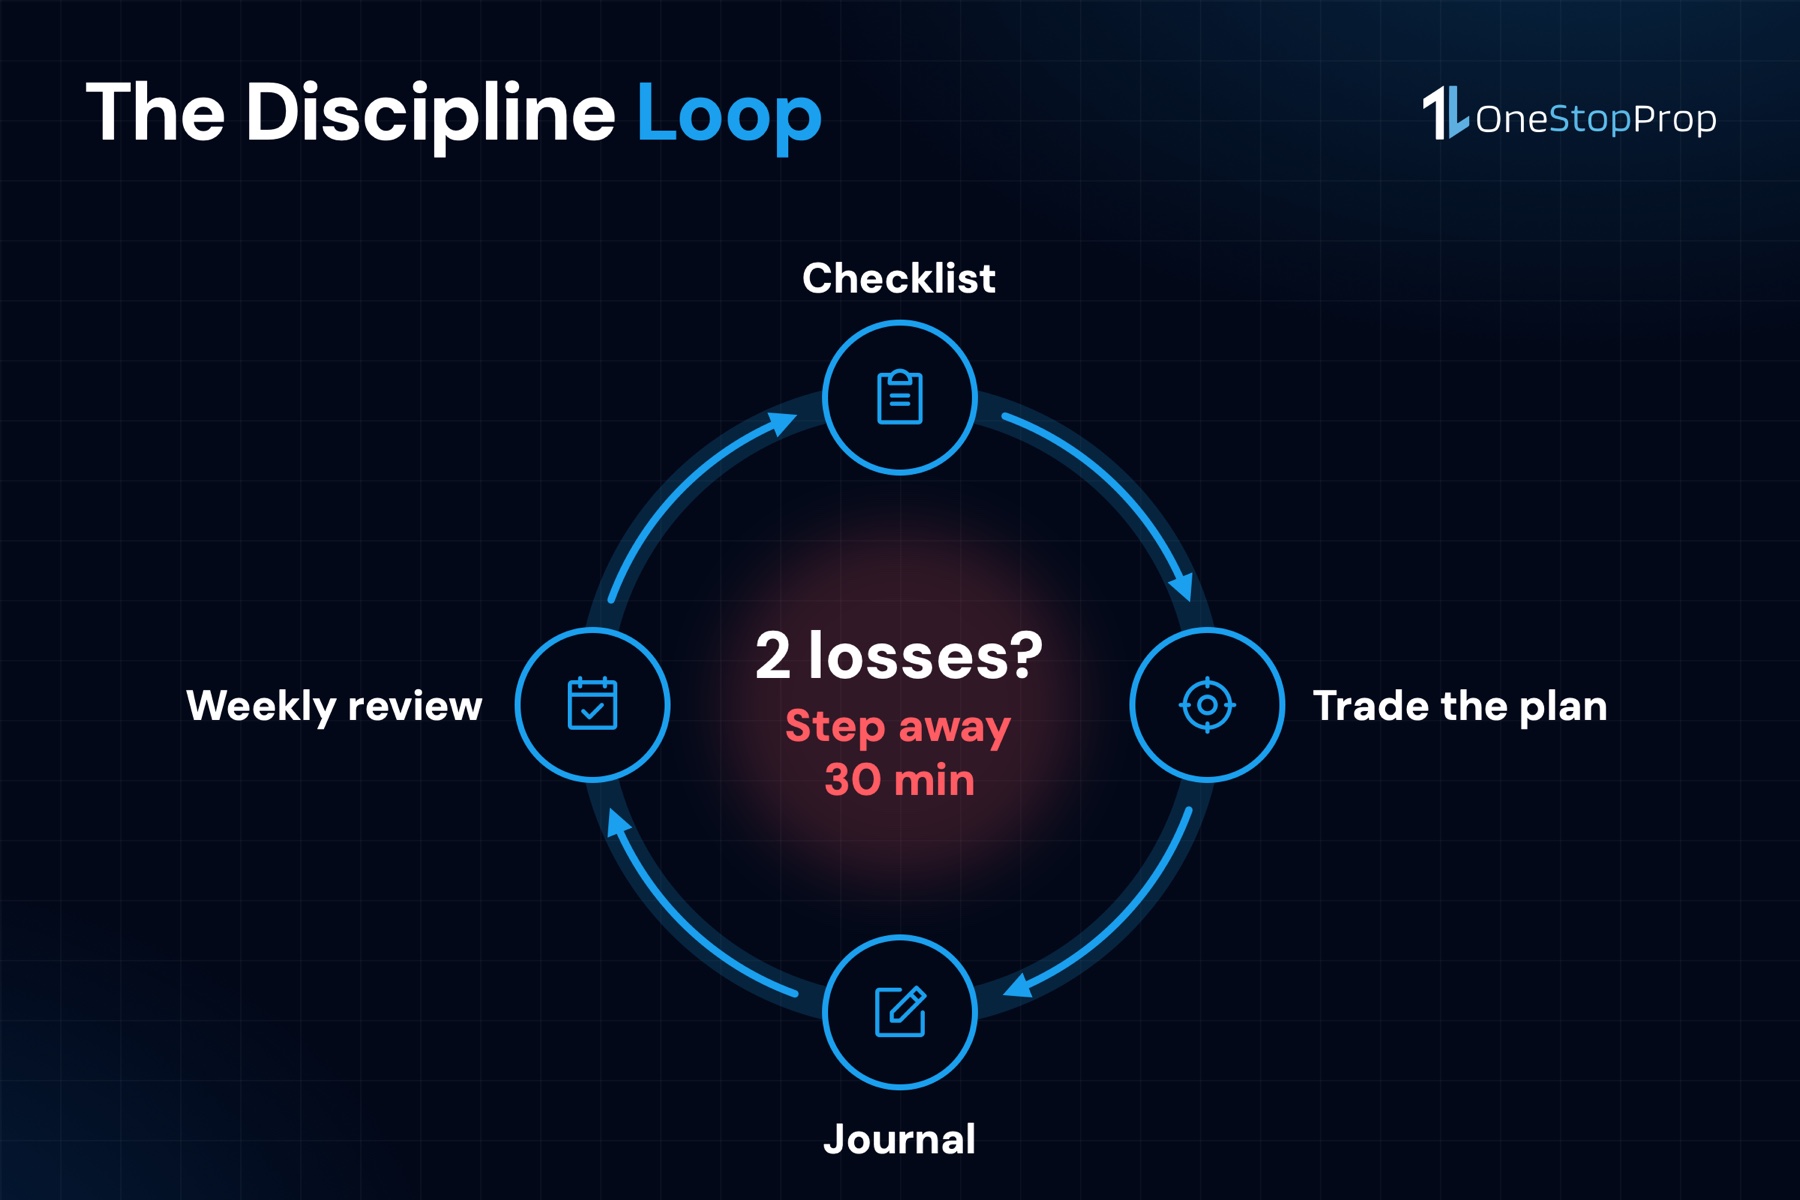
Prop trading psychology is the ability to manage emotions, follow a trading plan consistently, control risk, and make disciplined decisions while trading under the rules and pressure of a prop firm. The firms that pay out consistently reward traders who build systems that reduce the role of in-the-moment emotion.
Practical habits that work:
- Write a pre-trade checklist and complete it before every session
- Journal emotional reactions alongside trade outcomes, not just profit and loss figures
- Stop trading immediately after 2 consecutive losses in a session and step away for at least 30 minutes
- Review your week’s trades with a focus on process adherence, not P&L outcomes alone
Common Mistakes That End Funded Stock Accounts
Oversizing During Winning Streaks
A streak of good trades can tempt traders to ignore risk rules and trade too aggressively. After a run of profitable days on names like NVIDIA (NVDA) or Meta (META), the instinct to increase position size feels rational. The problem is that winning streaks do not predict the next trade outcome. Increasing size after wins is a fast path toward a drawdown breach.
Ignoring Floating Losses
About 95% of evaluation failures unrealized losses toward drawdown limits, monitoring your net liquidation value can prevent unexpected account closures. A stock trade that is open and underwater counts against your daily limit in real time. Do not assume that only closed trades matter.
Revenge Trading After a Loss
Prop firm rules are almost identical to the risk management principles that profitable independent traders follow voluntarily, no revenge trading, no oversizing after losses, and no all-in bets hoping to recover. When you feel the urge to immediately re-enter a stock position after a stop-out, that urge is the signal to stop for the session.
Frequently Asked Questions
What is the ideal risk per trade for a prop firm stock account?
Most prop traders risk 0.5% to 1% per trade to protect their accounts and stay within drawdown limits. For newer traders or those in the early stages of a challenge, starting at 0.25%-0.5% gives significantly more room to absorb losing streaks without approaching the daily drawdown ceiling. Increase risk only after you have demonstrated consistent adherence to your plan.
What is the difference between static and trailing drawdown?
Static drawdown is a prop firm loss limit fixed to your starting balance: on a $100,000 account with a 10% static drawdown, the floor sits at $90,000 and never moves, no matter how much the account grows. Trailing drawdown, by contrast, follows your highest balance or equity upward, so profits raise the level at which you fail. Static drawdown is generally more forgiving for swing-style stock traders who hold positions across sessions.
Can I trade the Magnificent 7 stocks in a prop firm account?
Yes. OneStopProp, for example, offers access to the Magnificent 7 stocks, Apple (AAPL), NVIDIA (NVDA), Microsoft (MSFT), Amazon (AMZN), Alphabet/Google (GOOGL), Meta (META), and Tesla (TSLA), through a single funded account, alongside Forex and Crypto. Traders can trade stocks, forex crypto, indices, and metals through one funded account, with no deadline to pass and the ability to complete the evaluation at their own pace. The key consideration for these stocks is that their higher volatility requires proportionally smaller share counts to keep dollar risk constant.
How does the consistency rule affect payouts?
No single trading day can account for 25% or more of your total profits during the payout cycle. If it does, you will need to continue trading until that day falls below the 25% threshold. This rule exists at firms like OneStopProp to ensure that payouts reflect a pattern of consistent trading rather than 1 outsized lucky session. The implication is straightforward: spread profits across multiple trading days rather than concentrating on 1 or 2 high-conviction trades.
What should I do after hitting my daily loss limit?
Stop trading immediately and do not attempt to re-enter the market. The daily loss limit exists. Your firm will enforce it. You will get locked out. Use the remainder of the session to review what led to the losses, whether it was position sizing, strategy deviation, or news-driven volatility that your entry timing did not account for. Return the next day with smaller initial position sizes until confidence and consistency are re-established.
Final Thoughts
Prop firm risk management for stocks is not a complex subject, but it requires consistent execution of simple rules under real market pressure. Know your drawdown type. Size positions from the risk budget backward, not from conviction forward. Set a personal daily cap at half the firm’s limit. Target a minimum 1:2 risk-reward ratio on every stock trade. And build the psychological habits that make the rules sustainable across hundreds of trading sessions, not just the first few days of a challenge.
If you are looking for a prop firm that pairs straightforward stock trading access with transparent rules, OneStopProp provides funded accounts from $10K to $300K with access to the full Magnificent 7 lineup and no artificial deadline pressure to complete your evaluation. Traders looking for expanded capital access can explore the OneStopProp Pro Account, which offers a structured path toward a $1.2 million total allocation, built for traders who are serious about treating prop trading as a business.
Sources
- Prop Firm Risk Management Framework, TradeZella. Practical framework for daily loss discipline and challenge phases. https://www.tradezella.com/blog/pass-prop-firm-challenge
- Trading Risk Management: Position Sizing and Drawdowns, QuantVPS. Data on prop firm failure rates and drawdown management. https://dealpropfirm.com/blog/risk-management-prop-traders-guide
- Prop Firm Drawdown Rules 2026: Static vs Trailing, Traders Second Brain. Guide to drawdown types and position sizing math. https://traderssecondbrain.com/guides/prop-firm-drawdown-rules
- Prop Firm Drawdown Explained: Rules, Types and Limits, TradeClaris. Mechanics of daily and maximum drawdown limits. https://www.tradeclaris.com/blogs/prop-firm-drawdown-explained
- Prop Trading Rules You Must Know Before Taking a Challenge, ForTraders. Evaluation rule matrix and daily loss analysis. https://fortraders.com/blog/prop-trading-rules-you-must-know-before-taking-a-challenge
- Position Sizing for Prop Firms, Traders Second Brain. Percentage risk analysis and consecutive loss math. https://traderssecondbrain.com/guides/position-sizing-for-prop-firms
- Risk-Reward Ratio: Why 1:2 Is the Minimum, Dolvero. Mathematical analysis of breakeven win rates by ratio. https://dolvero.com/blog/risk-reward-ratio-minimum-1-2
- Risk Reward Ratio in Prop Trading, ForTraders. Formula, worked examples, and win rate tables. https://fortraders.com/blog/risk-reward-ratio-how-to-use-it-to-your-advantage
- Position Sizing 101 for Prop Traders, Myfxbook. Formula and worked examples across account sizes. https://www.myfxbook.com/articles/position-sizing-101-for-prop-traders/76
- Risk Management for Prop Trading: 2026 Framework, PropTradingVibes. Position sizing, correlation risk, and daily budgets. https://proptradingvibes.com/blog/risk-management-prop-trading
- Trading Psychology for Prop Firm Traders, PropJournal. Psychological stressors, emotional cycles, and physical health data. https://propjournal.net/guides/prop-firm-trading-psychology
- Prop Firm Trading Psychology: Discipline and Consistency, ThePropFirmGuide. Recovery, burnout, and emotional resilience strategies. https://thepropfirmguide.com/prop-firm-trading-psychology/
- What Are the Magnificent 7 Stocks?, Fidelity. Volatility characteristics and historical performance of Mag 7. https://www.fidelity.com/learning-center/smart-money/magnificent-7-stocks
- The Magnificent Seven’s Market Cap vs. the S&P 500, Motley Fool. Market cap weighting and 2026 performance data. https://www.fool.com/research/magnificent-seven-sp-500/
- OneStopProp Funded Account, OneStopProp. Account rules, payout structure, and stock trading access. https://onestopprop.com/
- OneStopProp Payout Rules, OneStopProp. Consistency rule, payout cadence, and profit split details. https://help.onestopprop.com/faq/payout-rules/
- Risk Per Trade in a Prop Firm Challenge, AIFO. Safe percentage ranges and failure-buffer calculations. https://aifo.com/blog/guide/risk-per-trade-prop-firm-challenge/
- Position Sizing in Trading: Formula, Methods and Examples, Audacity Capital. Percentage-based method and prop account application. https://audacity.capital/trading-guides/position-sizing-in-trading/